Celtic vs Jamaican Cognitive Disability
COMPARE
Celtic
Jamaican
Cognitive Disability
Cognitive Disability Comparison
Celtics
Jamaicans
17.1%
COGNITIVE DISABILITY
74.1/ 100
METRIC RATING
158th/ 347
METRIC RANK
17.9%
COGNITIVE DISABILITY
0.9/ 100
METRIC RATING
244th/ 347
METRIC RANK
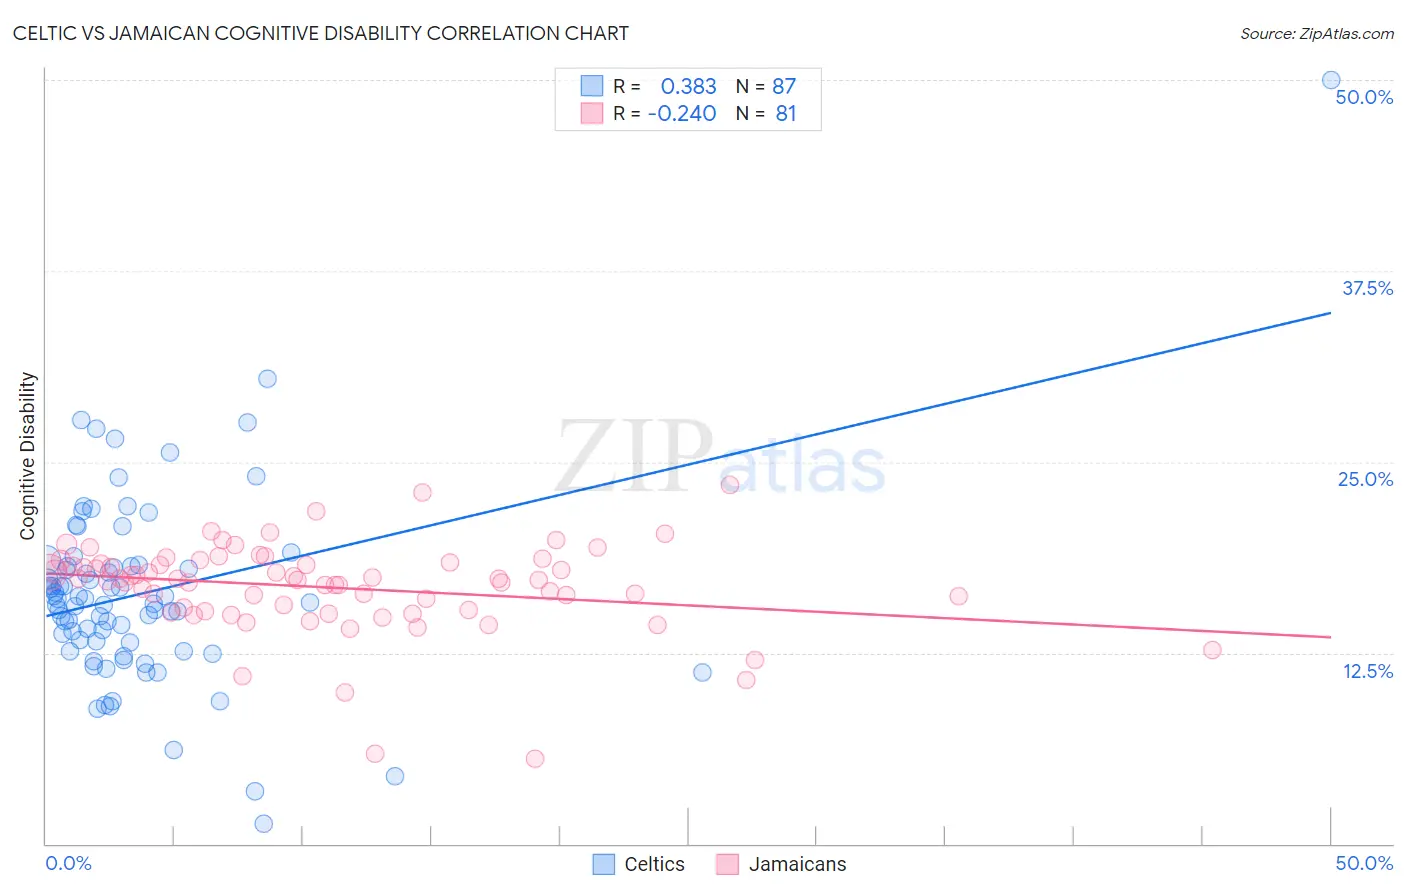
Celtic vs Jamaican Cognitive Disability Correlation Chart
The statistical analysis conducted on geographies consisting of 168,858,493 people shows a mild positive correlation between the proportion of Celtics and percentage of population with cognitive disability in the United States with a correlation coefficient (R) of 0.383 and weighted average of 17.1%. Similarly, the statistical analysis conducted on geographies consisting of 367,984,086 people shows a weak negative correlation between the proportion of Jamaicans and percentage of population with cognitive disability in the United States with a correlation coefficient (R) of -0.240 and weighted average of 17.9%, a difference of 4.1%.
Cognitive Disability Correlation Summary
| Measurement | Celtic | Jamaican |
| Minimum | 1.3% | 5.6% |
| Maximum | 50.0% | 23.5% |
| Range | 48.7% | 17.9% |
| Mean | 16.4% | 16.8% |
| Median | 15.8% | 17.3% |
| Interquartile 25% (IQ1) | 13.2% | 15.3% |
| Interquartile 75% (IQ3) | 18.2% | 18.4% |
| Interquartile Range (IQR) | 5.0% | 3.1% |
| Standard Deviation (Sample) | 6.4% | 3.0% |
| Standard Deviation (Population) | 6.3% | 3.0% |
Similar Demographics by Cognitive Disability
Demographics Similar to Celtics by Cognitive Disability
In terms of cognitive disability, the demographic groups most similar to Celtics are Immigrants from Latvia (17.2%, a difference of 0.030%), Australian (17.2%, a difference of 0.060%), Immigrants from Australia (17.1%, a difference of 0.070%), American (17.2%, a difference of 0.070%), and Yugoslavian (17.2%, a difference of 0.090%).
| Demographics | Rating | Rank | Cognitive Disability |
| Syrians | 83.0 /100 | #151 | Excellent 17.1% |
| Immigrants | Indonesia | 82.7 /100 | #152 | Excellent 17.1% |
| Immigrants | Kazakhstan | 80.5 /100 | #153 | Excellent 17.1% |
| Immigrants | Malaysia | 79.3 /100 | #154 | Good 17.1% |
| Brazilians | 78.9 /100 | #155 | Good 17.1% |
| Sri Lankans | 78.9 /100 | #156 | Good 17.1% |
| Immigrants | Australia | 76.0 /100 | #157 | Good 17.1% |
| Celtics | 74.1 /100 | #158 | Good 17.1% |
| Immigrants | Latvia | 73.2 /100 | #159 | Good 17.2% |
| Australians | 72.4 /100 | #160 | Good 17.2% |
| Americans | 72.2 /100 | #161 | Good 17.2% |
| Yugoslavians | 71.6 /100 | #162 | Good 17.2% |
| Immigrants | Switzerland | 71.5 /100 | #163 | Good 17.2% |
| Armenians | 70.1 /100 | #164 | Good 17.2% |
| Immigrants | Albania | 64.9 /100 | #165 | Good 17.2% |
Demographics Similar to Jamaicans by Cognitive Disability
In terms of cognitive disability, the demographic groups most similar to Jamaicans are Immigrants from Bangladesh (17.8%, a difference of 0.040%), Trinidadian and Tobagonian (17.9%, a difference of 0.090%), Paiute (17.8%, a difference of 0.11%), Immigrants from Thailand (17.9%, a difference of 0.12%), and Mexican (17.8%, a difference of 0.13%).
| Demographics | Rating | Rank | Cognitive Disability |
| Immigrants | Mexico | 1.8 /100 | #237 | Tragic 17.8% |
| Cheyenne | 1.7 /100 | #238 | Tragic 17.8% |
| Cajuns | 1.4 /100 | #239 | Tragic 17.8% |
| Iraqis | 1.4 /100 | #240 | Tragic 17.8% |
| Mexicans | 1.1 /100 | #241 | Tragic 17.8% |
| Paiute | 1.1 /100 | #242 | Tragic 17.8% |
| Immigrants | Bangladesh | 1.0 /100 | #243 | Tragic 17.8% |
| Jamaicans | 0.9 /100 | #244 | Tragic 17.9% |
| Trinidadians and Tobagonians | 0.8 /100 | #245 | Tragic 17.9% |
| Immigrants | Thailand | 0.8 /100 | #246 | Tragic 17.9% |
| Samoans | 0.7 /100 | #247 | Tragic 17.9% |
| French American Indians | 0.7 /100 | #248 | Tragic 17.9% |
| Cree | 0.7 /100 | #249 | Tragic 17.9% |
| Immigrants | Ethiopia | 0.7 /100 | #250 | Tragic 17.9% |
| Malaysians | 0.6 /100 | #251 | Tragic 17.9% |