Carpatho Rusyn vs Peruvian Hearing Disability
COMPARE
Carpatho Rusyn
Peruvian
Hearing Disability
Hearing Disability Comparison
Carpatho Rusyns
Peruvians
3.4%
HEARING DISABILITY
0.3/ 100
METRIC RATING
253rd/ 347
METRIC RANK
2.7%
HEARING DISABILITY
97.7/ 100
METRIC RATING
70th/ 347
METRIC RANK
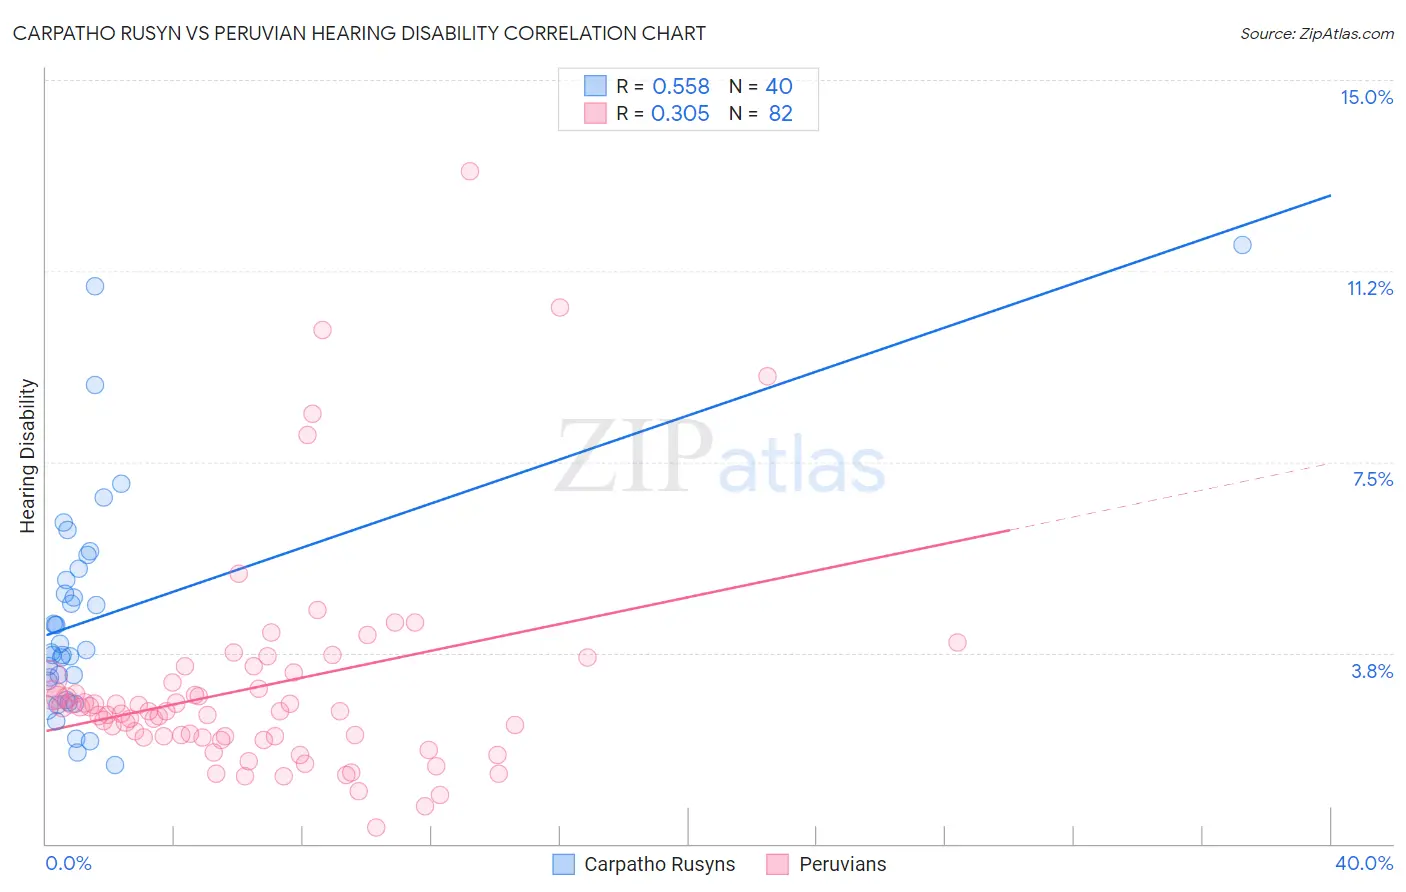
Carpatho Rusyn vs Peruvian Hearing Disability Correlation Chart
The statistical analysis conducted on geographies consisting of 58,869,507 people shows a substantial positive correlation between the proportion of Carpatho Rusyns and percentage of population with hearing disability in the United States with a correlation coefficient (R) of 0.558 and weighted average of 3.4%. Similarly, the statistical analysis conducted on geographies consisting of 363,103,364 people shows a mild positive correlation between the proportion of Peruvians and percentage of population with hearing disability in the United States with a correlation coefficient (R) of 0.305 and weighted average of 2.7%, a difference of 24.8%.
Hearing Disability Correlation Summary
| Measurement | Carpatho Rusyn | Peruvian |
| Minimum | 1.5% | 0.31% |
| Maximum | 11.8% | 13.2% |
| Range | 10.2% | 12.9% |
| Mean | 4.5% | 3.1% |
| Median | 3.8% | 2.6% |
| Interquartile 25% (IQ1) | 3.0% | 2.1% |
| Interquartile 75% (IQ3) | 5.3% | 3.2% |
| Interquartile Range (IQR) | 2.3% | 1.2% |
| Standard Deviation (Sample) | 2.2% | 2.2% |
| Standard Deviation (Population) | 2.2% | 2.2% |
Similar Demographics by Hearing Disability
Demographics Similar to Carpatho Rusyns by Hearing Disability
In terms of hearing disability, the demographic groups most similar to Carpatho Rusyns are Slavic (3.4%, a difference of 0.42%), Croatian (3.4%, a difference of 0.45%), Polish (3.4%, a difference of 0.65%), Hungarian (3.4%, a difference of 0.66%), and Hmong (3.4%, a difference of 0.70%).
| Demographics | Rating | Rank | Hearing Disability |
| Immigrants | England | 0.7 /100 | #246 | Tragic 3.3% |
| Lithuanians | 0.6 /100 | #247 | Tragic 3.4% |
| Austrians | 0.6 /100 | #248 | Tragic 3.4% |
| Italians | 0.4 /100 | #249 | Tragic 3.4% |
| Yuman | 0.4 /100 | #250 | Tragic 3.4% |
| Hungarians | 0.4 /100 | #251 | Tragic 3.4% |
| Croatians | 0.4 /100 | #252 | Tragic 3.4% |
| Carpatho Rusyns | 0.3 /100 | #253 | Tragic 3.4% |
| Slavs | 0.2 /100 | #254 | Tragic 3.4% |
| Poles | 0.2 /100 | #255 | Tragic 3.4% |
| Hmong | 0.2 /100 | #256 | Tragic 3.4% |
| Yaqui | 0.2 /100 | #257 | Tragic 3.4% |
| Northern Europeans | 0.2 /100 | #258 | Tragic 3.4% |
| Slovenes | 0.1 /100 | #259 | Tragic 3.5% |
| Portuguese | 0.1 /100 | #260 | Tragic 3.5% |
Demographics Similar to Peruvians by Hearing Disability
In terms of hearing disability, the demographic groups most similar to Peruvians are Central American (2.7%, a difference of 0.050%), Afghan (2.7%, a difference of 0.15%), Nicaraguan (2.7%, a difference of 0.23%), Argentinean (2.7%, a difference of 0.23%), and Immigrants from Korea (2.7%, a difference of 0.23%).
| Demographics | Rating | Rank | Hearing Disability |
| Indians (Asian) | 98.4 /100 | #63 | Exceptional 2.7% |
| Immigrants | Sri Lanka | 98.4 /100 | #64 | Exceptional 2.7% |
| Immigrants | Nepal | 98.3 /100 | #65 | Exceptional 2.7% |
| Immigrants | Belize | 98.2 /100 | #66 | Exceptional 2.7% |
| Egyptians | 98.1 /100 | #67 | Exceptional 2.7% |
| Immigrants | Africa | 98.0 /100 | #68 | Exceptional 2.7% |
| Nicaraguans | 97.9 /100 | #69 | Exceptional 2.7% |
| Peruvians | 97.7 /100 | #70 | Exceptional 2.7% |
| Central Americans | 97.7 /100 | #71 | Exceptional 2.7% |
| Afghans | 97.6 /100 | #72 | Exceptional 2.7% |
| Argentineans | 97.5 /100 | #73 | Exceptional 2.7% |
| Immigrants | Korea | 97.5 /100 | #74 | Exceptional 2.7% |
| Immigrants | Saudi Arabia | 97.5 /100 | #75 | Exceptional 2.7% |
| Asians | 97.5 /100 | #76 | Exceptional 2.7% |
| Immigrants | Malaysia | 97.5 /100 | #77 | Exceptional 2.7% |