Cape Verdean vs Spaniard Median Male Earnings
COMPARE
Cape Verdean
Spaniard
Median Male Earnings
Median Male Earnings Comparison
Cape Verdeans
Spaniards
$51,103
MEDIAN MALE EARNINGS
3.5/ 100
METRIC RATING
234th/ 347
METRIC RANK
$54,401
MEDIAN MALE EARNINGS
47.8/ 100
METRIC RATING
176th/ 347
METRIC RANK
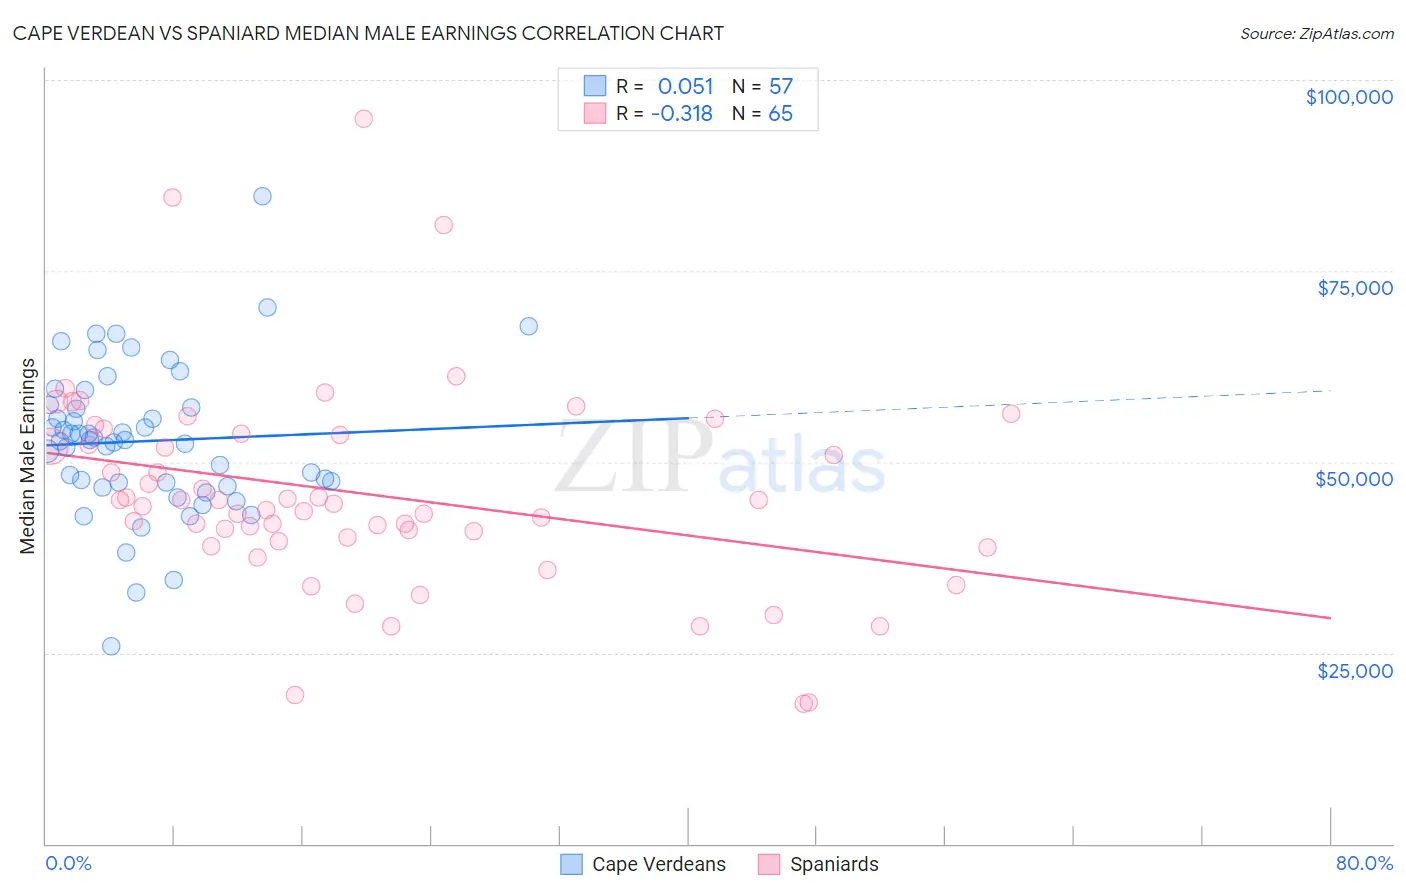
Cape Verdean vs Spaniard Median Male Earnings Correlation Chart
The statistical analysis conducted on geographies consisting of 107,567,026 people shows a slight positive correlation between the proportion of Cape Verdeans and median male earnings in the United States with a correlation coefficient (R) of 0.051 and weighted average of $51,103. Similarly, the statistical analysis conducted on geographies consisting of 443,330,517 people shows a mild negative correlation between the proportion of Spaniards and median male earnings in the United States with a correlation coefficient (R) of -0.318 and weighted average of $54,401, a difference of 6.5%.
Median Male Earnings Correlation Summary
| Measurement | Cape Verdean | Spaniard |
| Minimum | $25,819 | $18,319 |
| Maximum | $84,702 | $95,000 |
| Range | $58,883 | $76,681 |
| Mean | $52,707 | $45,902 |
| Median | $52,842 | $44,474 |
| Interquartile 25% (IQ1) | $47,020 | $39,886 |
| Interquartile 75% (IQ3) | $57,300 | $53,625 |
| Interquartile Range (IQR) | $10,280 | $13,740 |
| Standard Deviation (Sample) | $9,854 | $13,482 |
| Standard Deviation (Population) | $9,767 | $13,378 |
Similar Demographics by Median Male Earnings
Demographics Similar to Cape Verdeans by Median Male Earnings
In terms of median male earnings, the demographic groups most similar to Cape Verdeans are Aleut ($51,168, a difference of 0.13%), Sudanese ($51,216, a difference of 0.22%), Barbadian ($51,236, a difference of 0.26%), Immigrants from Western Africa ($50,940, a difference of 0.32%), and Immigrants from Nigeria ($51,310, a difference of 0.40%).
| Demographics | Rating | Rank | Median Male Earnings |
| Trinidadians and Tobagonians | 4.8 /100 | #227 | Tragic $51,446 |
| Samoans | 4.6 /100 | #228 | Tragic $51,389 |
| Immigrants | Trinidad and Tobago | 4.5 /100 | #229 | Tragic $51,376 |
| Immigrants | Nigeria | 4.2 /100 | #230 | Tragic $51,310 |
| Barbadians | 3.9 /100 | #231 | Tragic $51,236 |
| Sudanese | 3.9 /100 | #232 | Tragic $51,216 |
| Aleuts | 3.7 /100 | #233 | Tragic $51,168 |
| Cape Verdeans | 3.5 /100 | #234 | Tragic $51,103 |
| Immigrants | Western Africa | 3.0 /100 | #235 | Tragic $50,940 |
| Pennsylvania Germans | 2.8 /100 | #236 | Tragic $50,878 |
| Immigrants | Barbados | 2.6 /100 | #237 | Tragic $50,795 |
| Malaysians | 2.5 /100 | #238 | Tragic $50,772 |
| Americans | 2.5 /100 | #239 | Tragic $50,761 |
| West Indians | 2.3 /100 | #240 | Tragic $50,682 |
| Immigrants | St. Vincent and the Grenadines | 2.3 /100 | #241 | Tragic $50,665 |
Demographics Similar to Spaniards by Median Male Earnings
In terms of median male earnings, the demographic groups most similar to Spaniards are Dutch ($54,410, a difference of 0.020%), South American ($54,492, a difference of 0.17%), South American Indian ($54,508, a difference of 0.20%), Costa Rican ($54,279, a difference of 0.22%), and Sierra Leonean ($54,279, a difference of 0.22%).
| Demographics | Rating | Rank | Median Male Earnings |
| French Canadians | 55.6 /100 | #169 | Average $54,722 |
| Finns | 55.6 /100 | #170 | Average $54,721 |
| Immigrants | Peru | 54.9 /100 | #171 | Average $54,695 |
| Welsh | 53.8 /100 | #172 | Average $54,647 |
| South American Indians | 50.4 /100 | #173 | Average $54,508 |
| South Americans | 50.0 /100 | #174 | Average $54,492 |
| Dutch | 48.0 /100 | #175 | Average $54,410 |
| Spaniards | 47.8 /100 | #176 | Average $54,401 |
| Costa Ricans | 44.8 /100 | #177 | Average $54,279 |
| Sierra Leoneans | 44.8 /100 | #178 | Average $54,279 |
| Celtics | 43.9 /100 | #179 | Average $54,242 |
| Iraqis | 42.5 /100 | #180 | Average $54,182 |
| Immigrants | Immigrants | 42.1 /100 | #181 | Average $54,168 |
| Yugoslavians | 37.4 /100 | #182 | Fair $53,967 |
| Immigrants | South America | 37.3 /100 | #183 | Fair $53,962 |