Cape Verdean vs Spaniard 6th Grade
COMPARE
Cape Verdean
Spaniard
6th Grade
6th Grade Comparison
Cape Verdeans
Spaniards
95.1%
6TH GRADE
0.0/ 100
METRIC RATING
324th/ 347
METRIC RANK
97.2%
6TH GRADE
80.1/ 100
METRIC RATING
145th/ 347
METRIC RANK
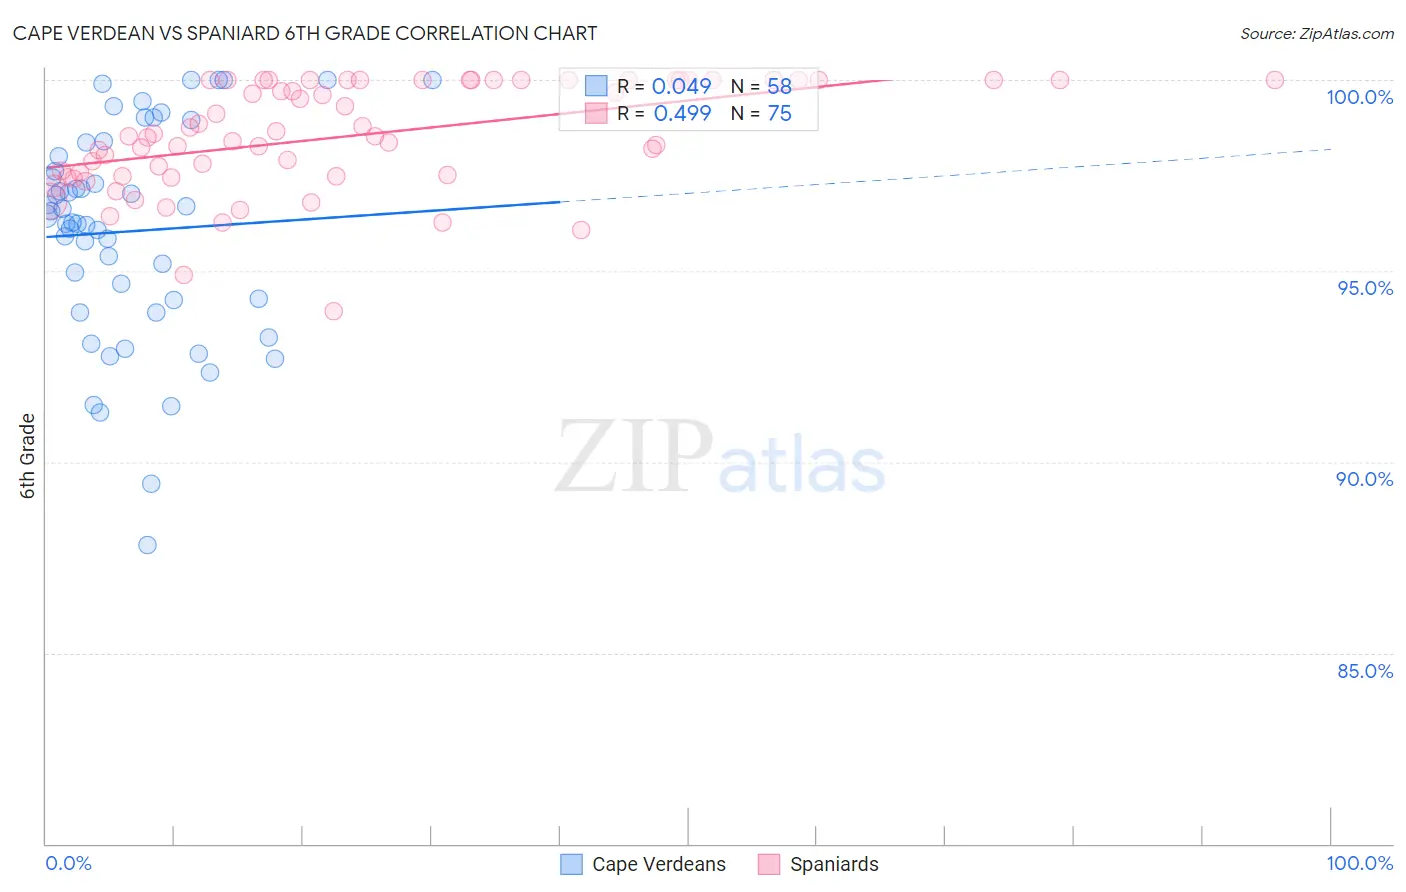
Cape Verdean vs Spaniard 6th Grade Correlation Chart
The statistical analysis conducted on geographies consisting of 107,537,955 people shows no correlation between the proportion of Cape Verdeans and percentage of population with at least 6th grade education in the United States with a correlation coefficient (R) of 0.049 and weighted average of 95.1%. Similarly, the statistical analysis conducted on geographies consisting of 443,544,503 people shows a moderate positive correlation between the proportion of Spaniards and percentage of population with at least 6th grade education in the United States with a correlation coefficient (R) of 0.499 and weighted average of 97.2%, a difference of 2.2%.
6th Grade Correlation Summary
| Measurement | Cape Verdean | Spaniard |
| Minimum | 87.8% | 93.9% |
| Maximum | 100.0% | 100.0% |
| Range | 12.2% | 6.1% |
| Mean | 96.0% | 98.5% |
| Median | 96.4% | 98.5% |
| Interquartile 25% (IQ1) | 94.3% | 97.5% |
| Interquartile 75% (IQ3) | 98.0% | 100.0% |
| Interquartile Range (IQR) | 3.8% | 2.5% |
| Standard Deviation (Sample) | 2.8% | 1.4% |
| Standard Deviation (Population) | 2.8% | 1.4% |
Similar Demographics by 6th Grade
Demographics Similar to Cape Verdeans by 6th Grade
In terms of 6th grade, the demographic groups most similar to Cape Verdeans are Central American Indian (95.1%, a difference of 0.030%), Immigrants from Nicaragua (95.1%, a difference of 0.030%), Immigrants from Cambodia (95.2%, a difference of 0.040%), Immigrants from Fiji (95.2%, a difference of 0.090%), and Hispanic or Latino (95.0%, a difference of 0.10%).
| Demographics | Rating | Rank | 6th Grade |
| Vietnamese | 0.0 /100 | #317 | Tragic 95.3% |
| Belizeans | 0.0 /100 | #318 | Tragic 95.3% |
| Immigrants | Belize | 0.0 /100 | #319 | Tragic 95.3% |
| Immigrants | Ecuador | 0.0 /100 | #320 | Tragic 95.3% |
| Immigrants | Fiji | 0.0 /100 | #321 | Tragic 95.2% |
| Immigrants | Cambodia | 0.0 /100 | #322 | Tragic 95.2% |
| Central American Indians | 0.0 /100 | #323 | Tragic 95.1% |
| Cape Verdeans | 0.0 /100 | #324 | Tragic 95.1% |
| Immigrants | Nicaragua | 0.0 /100 | #325 | Tragic 95.1% |
| Hispanics or Latinos | 0.0 /100 | #326 | Tragic 95.0% |
| Mexican American Indians | 0.0 /100 | #327 | Tragic 95.0% |
| Hondurans | 0.0 /100 | #328 | Tragic 95.0% |
| Dominicans | 0.0 /100 | #329 | Tragic 94.9% |
| Nepalese | 0.0 /100 | #330 | Tragic 94.9% |
| Immigrants | Armenia | 0.0 /100 | #331 | Tragic 94.9% |
Demographics Similar to Spaniards by 6th Grade
In terms of 6th grade, the demographic groups most similar to Spaniards are Hopi (97.2%, a difference of 0.010%), Immigrants from South Central Asia (97.2%, a difference of 0.010%), Pima (97.2%, a difference of 0.020%), Israeli (97.2%, a difference of 0.020%), and Immigrants from Greece (97.2%, a difference of 0.020%).
| Demographics | Rating | Rank | 6th Grade |
| Blackfeet | 87.7 /100 | #138 | Excellent 97.3% |
| Immigrants | Turkey | 86.1 /100 | #139 | Excellent 97.3% |
| Immigrants | North Macedonia | 85.5 /100 | #140 | Excellent 97.2% |
| Seminole | 84.8 /100 | #141 | Excellent 97.2% |
| Jordanians | 84.6 /100 | #142 | Excellent 97.2% |
| Pima | 82.9 /100 | #143 | Excellent 97.2% |
| Israelis | 82.9 /100 | #144 | Excellent 97.2% |
| Spaniards | 80.1 /100 | #145 | Excellent 97.2% |
| Hopi | 78.8 /100 | #146 | Good 97.2% |
| Immigrants | South Central Asia | 78.1 /100 | #147 | Good 97.2% |
| Immigrants | Greece | 77.8 /100 | #148 | Good 97.2% |
| Immigrants | Israel | 76.0 /100 | #149 | Good 97.2% |
| Immigrants | Bosnia and Herzegovina | 74.8 /100 | #150 | Good 97.2% |
| French American Indians | 74.0 /100 | #151 | Good 97.2% |
| Immigrants | Jordan | 73.0 /100 | #152 | Good 97.2% |