Immigrants from Serbia vs Spaniard Ambulatory Disability
COMPARE
Immigrants from Serbia
Spaniard
Ambulatory Disability
Ambulatory Disability Comparison
Immigrants from Serbia
Spaniards
5.8%
AMBULATORY DISABILITY
97.9/ 100
METRIC RATING
100th/ 347
METRIC RANK
6.5%
AMBULATORY DISABILITY
1.6/ 100
METRIC RATING
242nd/ 347
METRIC RANK
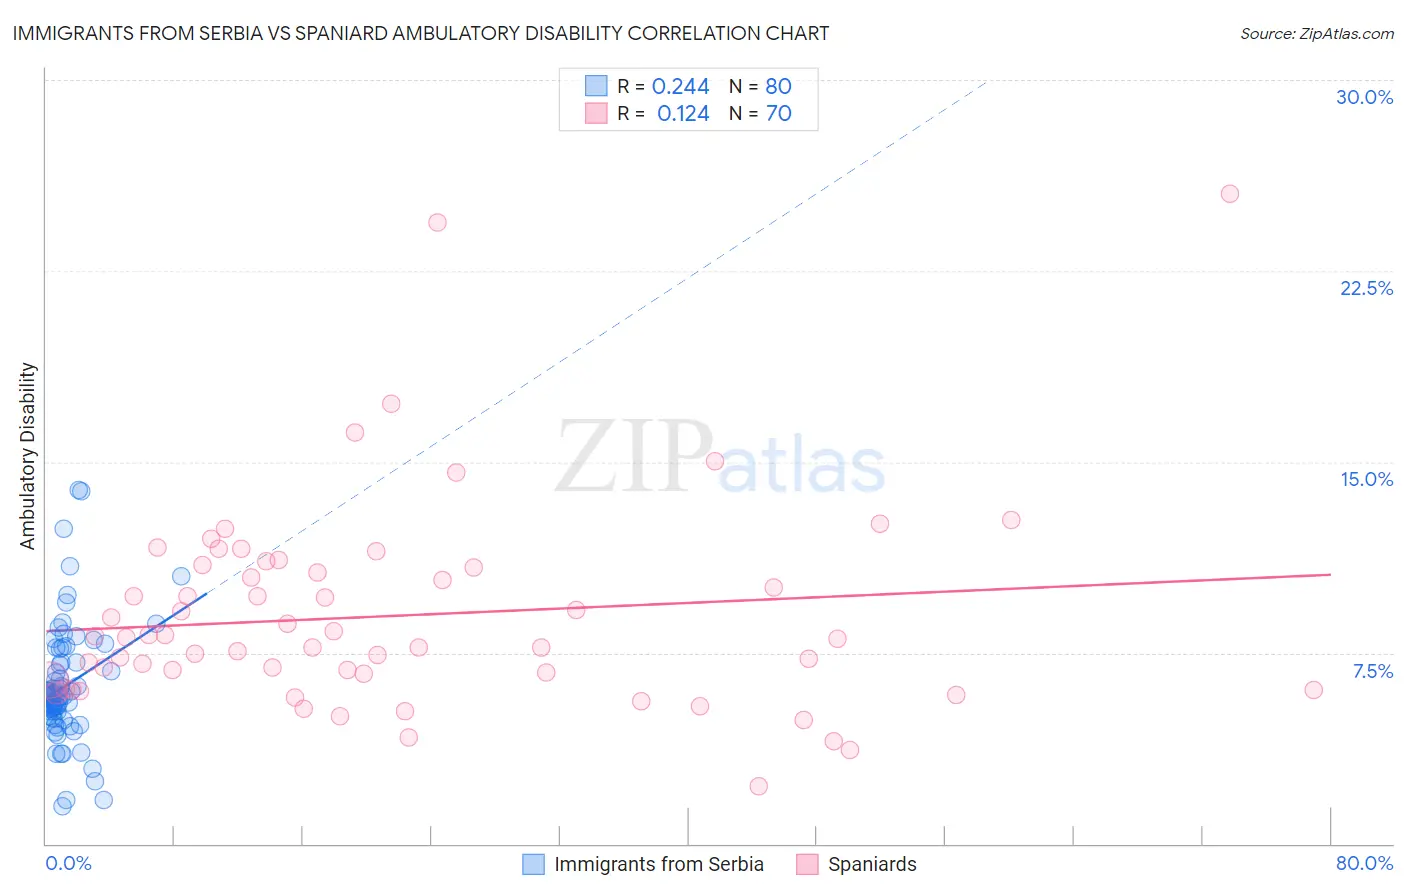
Immigrants from Serbia vs Spaniard Ambulatory Disability Correlation Chart
The statistical analysis conducted on geographies consisting of 131,742,099 people shows a weak positive correlation between the proportion of Immigrants from Serbia and percentage of population with ambulatory disability in the United States with a correlation coefficient (R) of 0.244 and weighted average of 5.8%. Similarly, the statistical analysis conducted on geographies consisting of 443,300,484 people shows a poor positive correlation between the proportion of Spaniards and percentage of population with ambulatory disability in the United States with a correlation coefficient (R) of 0.124 and weighted average of 6.5%, a difference of 11.2%.
Ambulatory Disability Correlation Summary
| Measurement | Immigrants from Serbia | Spaniard |
| Minimum | 1.5% | 2.3% |
| Maximum | 13.9% | 25.6% |
| Range | 12.5% | 23.3% |
| Mean | 6.2% | 9.0% |
| Median | 5.8% | 8.1% |
| Interquartile 25% (IQ1) | 5.1% | 6.4% |
| Interquartile 75% (IQ3) | 7.1% | 10.9% |
| Interquartile Range (IQR) | 2.0% | 4.4% |
| Standard Deviation (Sample) | 2.3% | 4.1% |
| Standard Deviation (Population) | 2.3% | 4.0% |
Similar Demographics by Ambulatory Disability
Demographics Similar to Immigrants from Serbia by Ambulatory Disability
In terms of ambulatory disability, the demographic groups most similar to Immigrants from Serbia are Immigrants from South America (5.8%, a difference of 0.0%), Immigrants from Kenya (5.8%, a difference of 0.080%), Immigrants from Romania (5.8%, a difference of 0.15%), Immigrants from Northern Europe (5.8%, a difference of 0.19%), and New Zealander (5.8%, a difference of 0.21%).
| Demographics | Rating | Rank | Ambulatory Disability |
| Immigrants | Denmark | 98.6 /100 | #93 | Exceptional 5.8% |
| Kenyans | 98.4 /100 | #94 | Exceptional 5.8% |
| Immigrants | El Salvador | 98.4 /100 | #95 | Exceptional 5.8% |
| Salvadorans | 98.4 /100 | #96 | Exceptional 5.8% |
| Immigrants | Somalia | 98.3 /100 | #97 | Exceptional 5.8% |
| Immigrants | Lebanon | 98.3 /100 | #98 | Exceptional 5.8% |
| Immigrants | Northern Europe | 98.2 /100 | #99 | Exceptional 5.8% |
| Immigrants | Serbia | 97.9 /100 | #100 | Exceptional 5.8% |
| Immigrants | South America | 97.9 /100 | #101 | Exceptional 5.8% |
| Immigrants | Kenya | 97.8 /100 | #102 | Exceptional 5.8% |
| Immigrants | Romania | 97.7 /100 | #103 | Exceptional 5.8% |
| New Zealanders | 97.6 /100 | #104 | Exceptional 5.8% |
| Immigrants | Czechoslovakia | 97.4 /100 | #105 | Exceptional 5.8% |
| Immigrants | Morocco | 97.3 /100 | #106 | Exceptional 5.8% |
| Uruguayans | 97.2 /100 | #107 | Exceptional 5.8% |
Demographics Similar to Spaniards by Ambulatory Disability
In terms of ambulatory disability, the demographic groups most similar to Spaniards are German (6.5%, a difference of 0.020%), Immigrants from Panama (6.5%, a difference of 0.020%), Immigrants from Haiti (6.5%, a difference of 0.030%), Tlingit-Haida (6.5%, a difference of 0.060%), and Armenian (6.5%, a difference of 0.070%).
| Demographics | Rating | Rank | Ambulatory Disability |
| Hispanics or Latinos | 2.2 /100 | #235 | Tragic 6.4% |
| Dutch | 2.0 /100 | #236 | Tragic 6.4% |
| Immigrants | Germany | 1.8 /100 | #237 | Tragic 6.4% |
| Haitians | 1.8 /100 | #238 | Tragic 6.4% |
| Senegalese | 1.7 /100 | #239 | Tragic 6.4% |
| Immigrants | Senegal | 1.7 /100 | #240 | Tragic 6.4% |
| Immigrants | Haiti | 1.6 /100 | #241 | Tragic 6.5% |
| Spaniards | 1.6 /100 | #242 | Tragic 6.5% |
| Germans | 1.5 /100 | #243 | Tragic 6.5% |
| Immigrants | Panama | 1.5 /100 | #244 | Tragic 6.5% |
| Tlingit-Haida | 1.5 /100 | #245 | Tragic 6.5% |
| Armenians | 1.5 /100 | #246 | Tragic 6.5% |
| Immigrants | Cuba | 1.4 /100 | #247 | Tragic 6.5% |
| Immigrants | Portugal | 1.4 /100 | #248 | Tragic 6.5% |
| Native Hawaiians | 1.1 /100 | #249 | Tragic 6.5% |