Immigrants from Senegal vs Immigrants from Guyana Vision Disability
COMPARE
Immigrants from Senegal
Immigrants from Guyana
Vision Disability
Vision Disability Comparison
Immigrants from Senegal
Immigrants from Guyana
2.3%
VISION DISABILITY
3.8/ 100
METRIC RATING
222nd/ 347
METRIC RANK
2.2%
VISION DISABILITY
15.9/ 100
METRIC RATING
204th/ 347
METRIC RANK
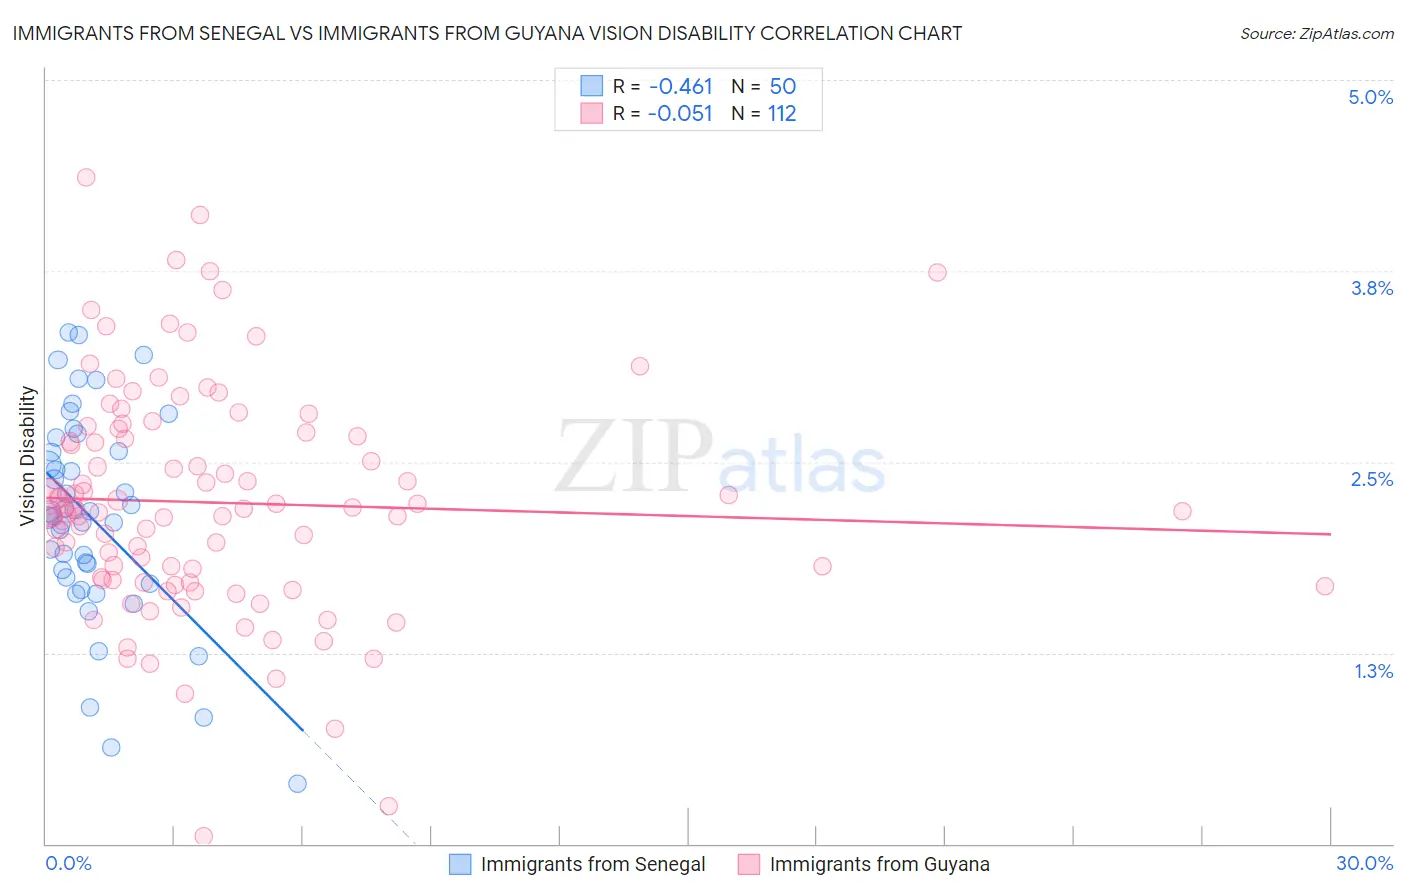
Immigrants from Senegal vs Immigrants from Guyana Vision Disability Correlation Chart
The statistical analysis conducted on geographies consisting of 90,101,349 people shows a moderate negative correlation between the proportion of Immigrants from Senegal and percentage of population with vision disability in the United States with a correlation coefficient (R) of -0.461 and weighted average of 2.3%. Similarly, the statistical analysis conducted on geographies consisting of 183,609,151 people shows a slight negative correlation between the proportion of Immigrants from Guyana and percentage of population with vision disability in the United States with a correlation coefficient (R) of -0.051 and weighted average of 2.2%, a difference of 2.4%.
Vision Disability Correlation Summary
| Measurement | Immigrants from Senegal | Immigrants from Guyana |
| Minimum | 0.39% | 0.051% |
| Maximum | 3.3% | 4.4% |
| Range | 3.0% | 4.3% |
| Mean | 2.1% | 2.2% |
| Median | 2.2% | 2.2% |
| Interquartile 25% (IQ1) | 1.7% | 1.7% |
| Interquartile 75% (IQ3) | 2.6% | 2.7% |
| Interquartile Range (IQR) | 0.83% | 0.95% |
| Standard Deviation (Sample) | 0.68% | 0.74% |
| Standard Deviation (Population) | 0.67% | 0.74% |
Demographics Similar to Immigrants from Senegal and Immigrants from Guyana by Vision Disability
In terms of vision disability, the demographic groups most similar to Immigrants from Senegal are French Canadian (2.3%, a difference of 0.020%), Guamanian/Chamorro (2.3%, a difference of 0.040%), Basque (2.3%, a difference of 0.14%), Ecuadorian (2.3%, a difference of 0.27%), and Portuguese (2.3%, a difference of 0.38%). Similarly, the demographic groups most similar to Immigrants from Guyana are Samoan (2.2%, a difference of 0.030%), Dutch (2.2%, a difference of 0.13%), Pennsylvania German (2.2%, a difference of 0.17%), Immigrants from Nigeria (2.2%, a difference of 0.30%), and German (2.2%, a difference of 0.31%).
| Demographics | Rating | Rank | Vision Disability |
| Dutch | 17.1 /100 | #203 | Poor 2.2% |
| Immigrants | Guyana | 15.9 /100 | #204 | Poor 2.2% |
| Samoans | 15.7 /100 | #205 | Poor 2.2% |
| Pennsylvania Germans | 14.5 /100 | #206 | Poor 2.2% |
| Immigrants | Nigeria | 13.5 /100 | #207 | Poor 2.2% |
| Germans | 13.4 /100 | #208 | Poor 2.2% |
| Immigrants | Brazil | 13.1 /100 | #209 | Poor 2.2% |
| Immigrants | Uruguay | 11.5 /100 | #210 | Poor 2.2% |
| Indonesians | 9.5 /100 | #211 | Tragic 2.2% |
| Bermudans | 9.0 /100 | #212 | Tragic 2.2% |
| Immigrants | Ghana | 8.9 /100 | #213 | Tragic 2.2% |
| Trinidadians and Tobagonians | 8.2 /100 | #214 | Tragic 2.2% |
| Nigerians | 7.2 /100 | #215 | Tragic 2.3% |
| Immigrants | Trinidad and Tobago | 6.1 /100 | #216 | Tragic 2.3% |
| Barbadians | 5.1 /100 | #217 | Tragic 2.3% |
| Portuguese | 4.9 /100 | #218 | Tragic 2.3% |
| Ecuadorians | 4.6 /100 | #219 | Tragic 2.3% |
| Guamanians/Chamorros | 3.9 /100 | #220 | Tragic 2.3% |
| French Canadians | 3.9 /100 | #221 | Tragic 2.3% |
| Immigrants | Senegal | 3.8 /100 | #222 | Tragic 2.3% |
| Basques | 3.5 /100 | #223 | Tragic 2.3% |