Cape Verdean vs Immigrants from Guyana Unemployment Among Ages 30 to 34 years
COMPARE
Cape Verdean
Immigrants from Guyana
Unemployment Among Ages 30 to 34 years
Unemployment Among Ages 30 to 34 years Comparison
Cape Verdeans
Immigrants from Guyana
7.2%
UNEMPLOYMENT AMONG AGES 30 TO 34 YEARS
0.0/ 100
METRIC RATING
320th/ 347
METRIC RANK
7.2%
UNEMPLOYMENT AMONG AGES 30 TO 34 YEARS
0.0/ 100
METRIC RATING
321st/ 347
METRIC RANK
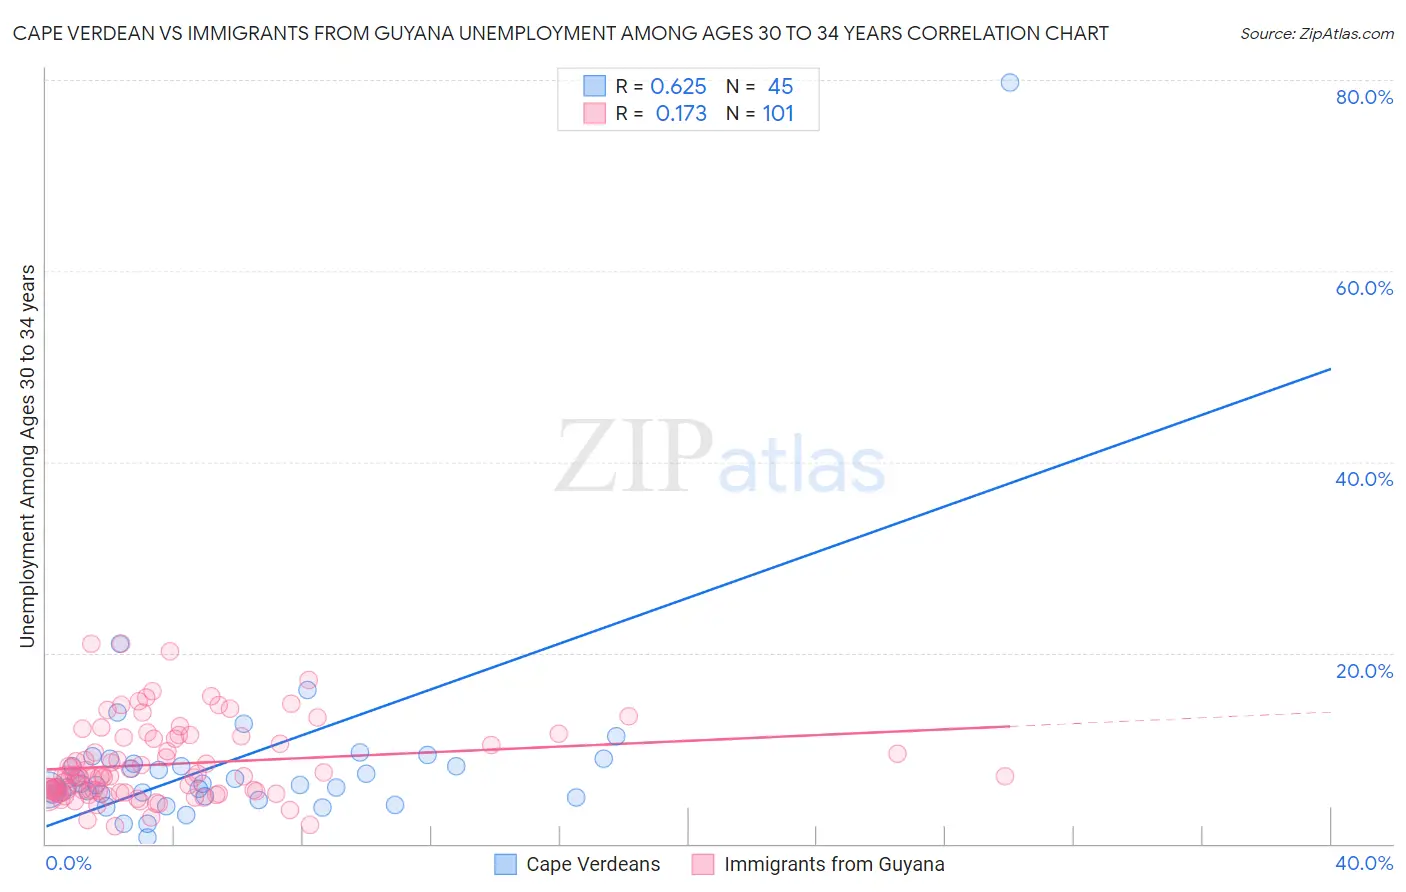
Cape Verdean vs Immigrants from Guyana Unemployment Among Ages 30 to 34 years Correlation Chart
The statistical analysis conducted on geographies consisting of 105,621,917 people shows a significant positive correlation between the proportion of Cape Verdeans and unemployment rate among population between the ages 30 and 34 in the United States with a correlation coefficient (R) of 0.625 and weighted average of 7.2%. Similarly, the statistical analysis conducted on geographies consisting of 178,683,366 people shows a poor positive correlation between the proportion of Immigrants from Guyana and unemployment rate among population between the ages 30 and 34 in the United States with a correlation coefficient (R) of 0.173 and weighted average of 7.2%, a difference of 0.29%.
Unemployment Among Ages 30 to 34 years Correlation Summary
| Measurement | Cape Verdean | Immigrants from Guyana |
| Minimum | 0.60% | 1.8% |
| Maximum | 79.7% | 21.0% |
| Range | 79.1% | 19.2% |
| Mean | 8.6% | 8.3% |
| Median | 6.2% | 7.1% |
| Interquartile 25% (IQ1) | 5.1% | 5.4% |
| Interquartile 75% (IQ3) | 8.7% | 11.1% |
| Interquartile Range (IQR) | 3.6% | 5.6% |
| Standard Deviation (Sample) | 11.4% | 4.1% |
| Standard Deviation (Population) | 11.3% | 4.1% |
Demographics Similar to Cape Verdeans and Immigrants from Guyana by Unemployment Among Ages 30 to 34 years
In terms of unemployment among ages 30 to 34 years, the demographic groups most similar to Cape Verdeans are Guyanese (7.2%, a difference of 0.020%), Black/African American (7.2%, a difference of 0.090%), Immigrants from Cabo Verde (7.2%, a difference of 0.19%), Houma (7.2%, a difference of 0.46%), and Marshallese (7.2%, a difference of 0.79%). Similarly, the demographic groups most similar to Immigrants from Guyana are Guyanese (7.2%, a difference of 0.31%), Black/African American (7.2%, a difference of 0.38%), Immigrants from Cabo Verde (7.2%, a difference of 0.48%), Marshallese (7.2%, a difference of 0.50%), and Houma (7.2%, a difference of 0.75%).
| Demographics | Rating | Rank | Unemployment Among Ages 30 to 34 years |
| Immigrants | St. Vincent and the Grenadines | 0.0 /100 | #310 | Tragic 7.0% |
| Alaskan Athabascans | 0.0 /100 | #311 | Tragic 7.0% |
| British West Indians | 0.0 /100 | #312 | Tragic 7.0% |
| Ute | 0.0 /100 | #313 | Tragic 7.0% |
| Lumbee | 0.0 /100 | #314 | Tragic 7.1% |
| Aleuts | 0.0 /100 | #315 | Tragic 7.1% |
| Houma | 0.0 /100 | #316 | Tragic 7.2% |
| Immigrants | Cabo Verde | 0.0 /100 | #317 | Tragic 7.2% |
| Blacks/African Americans | 0.0 /100 | #318 | Tragic 7.2% |
| Guyanese | 0.0 /100 | #319 | Tragic 7.2% |
| Cape Verdeans | 0.0 /100 | #320 | Tragic 7.2% |
| Immigrants | Guyana | 0.0 /100 | #321 | Tragic 7.2% |
| Marshallese | 0.0 /100 | #322 | Tragic 7.2% |
| Immigrants | Yemen | 0.0 /100 | #323 | Tragic 7.3% |
| Immigrants | Dominica | 0.0 /100 | #324 | Tragic 7.3% |
| Apache | 0.0 /100 | #325 | Tragic 7.3% |
| Dominicans | 0.0 /100 | #326 | Tragic 7.7% |
| Immigrants | Dominican Republic | 0.0 /100 | #327 | Tragic 7.7% |
| Chippewa | 0.0 /100 | #328 | Tragic 7.8% |
| Cheyenne | 0.0 /100 | #329 | Tragic 7.8% |
| Shoshone | 0.0 /100 | #330 | Tragic 7.9% |