Canadian vs Icelander Cognitive Disability
COMPARE
Canadian
Icelander
Cognitive Disability
Cognitive Disability Comparison
Canadians
Icelanders
16.8%
COGNITIVE DISABILITY
97.5/ 100
METRIC RATING
108th/ 347
METRIC RANK
17.6%
COGNITIVE DISABILITY
6.4/ 100
METRIC RATING
218th/ 347
METRIC RANK
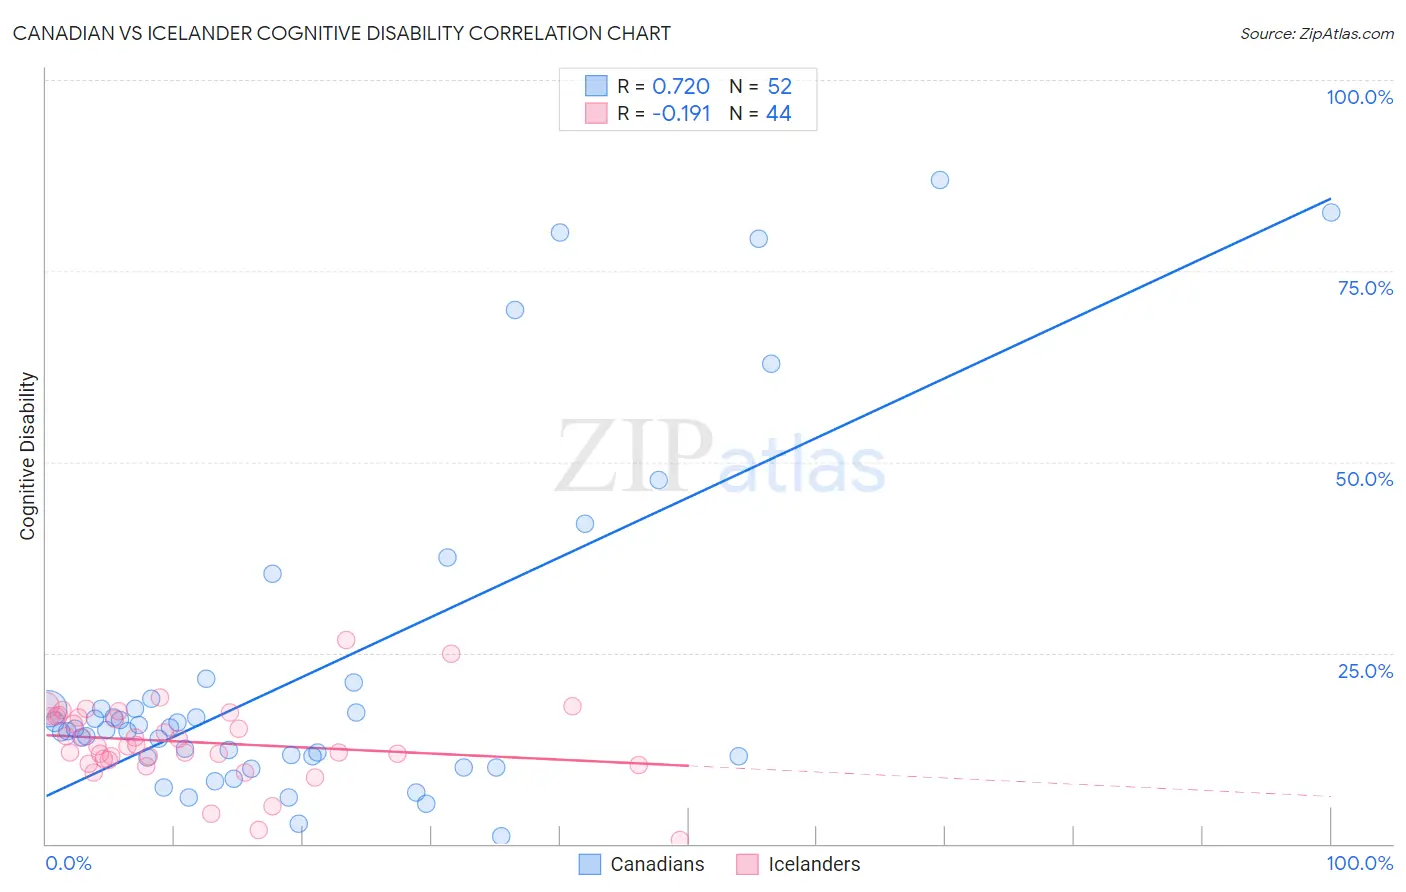
Canadian vs Icelander Cognitive Disability Correlation Chart
The statistical analysis conducted on geographies consisting of 437,506,516 people shows a strong positive correlation between the proportion of Canadians and percentage of population with cognitive disability in the United States with a correlation coefficient (R) of 0.720 and weighted average of 16.8%. Similarly, the statistical analysis conducted on geographies consisting of 159,644,345 people shows a poor negative correlation between the proportion of Icelanders and percentage of population with cognitive disability in the United States with a correlation coefficient (R) of -0.191 and weighted average of 17.6%, a difference of 4.6%.
Cognitive Disability Correlation Summary
| Measurement | Canadian | Icelander |
| Minimum | 1.0% | 0.44% |
| Maximum | 87.0% | 26.7% |
| Range | 85.9% | 26.3% |
| Mean | 22.4% | 13.3% |
| Median | 15.0% | 12.8% |
| Interquartile 25% (IQ1) | 11.3% | 11.0% |
| Interquartile 75% (IQ3) | 18.4% | 16.8% |
| Interquartile Range (IQR) | 7.1% | 5.7% |
| Standard Deviation (Sample) | 21.9% | 5.1% |
| Standard Deviation (Population) | 21.7% | 5.0% |
Similar Demographics by Cognitive Disability
Demographics Similar to Canadians by Cognitive Disability
In terms of cognitive disability, the demographic groups most similar to Canadians are Albanian (16.8%, a difference of 0.050%), Arapaho (16.8%, a difference of 0.060%), Uruguayan (16.8%, a difference of 0.070%), Immigrants from Nicaragua (16.8%, a difference of 0.090%), and Indian (Asian) (16.8%, a difference of 0.090%).
| Demographics | Rating | Rank | Cognitive Disability |
| Immigrants | Asia | 98.1 /100 | #101 | Exceptional 16.8% |
| Irish | 98.1 /100 | #102 | Exceptional 16.8% |
| Paraguayans | 98.0 /100 | #103 | Exceptional 16.8% |
| Palestinians | 98.0 /100 | #104 | Exceptional 16.8% |
| Immigrants | Eastern Asia | 97.9 /100 | #105 | Exceptional 16.8% |
| Northern Europeans | 97.8 /100 | #106 | Exceptional 16.8% |
| Immigrants | Nicaragua | 97.8 /100 | #107 | Exceptional 16.8% |
| Canadians | 97.5 /100 | #108 | Exceptional 16.8% |
| Albanians | 97.3 /100 | #109 | Exceptional 16.8% |
| Arapaho | 97.3 /100 | #110 | Exceptional 16.8% |
| Uruguayans | 97.2 /100 | #111 | Exceptional 16.8% |
| Indians (Asian) | 97.2 /100 | #112 | Exceptional 16.8% |
| Immigrants | Sri Lanka | 97.1 /100 | #113 | Exceptional 16.8% |
| Koreans | 97.1 /100 | #114 | Exceptional 16.8% |
| Yup'ik | 96.9 /100 | #115 | Exceptional 16.9% |
Demographics Similar to Icelanders by Cognitive Disability
In terms of cognitive disability, the demographic groups most similar to Icelanders are Immigrants from Sierra Leone (17.6%, a difference of 0.010%), Salvadoran (17.6%, a difference of 0.030%), Zimbabwean (17.6%, a difference of 0.040%), Okinawan (17.6%, a difference of 0.050%), and Moroccan (17.6%, a difference of 0.050%).
| Demographics | Rating | Rank | Cognitive Disability |
| Taiwanese | 7.7 /100 | #211 | Tragic 17.6% |
| Immigrants | Oceania | 7.3 /100 | #212 | Tragic 17.6% |
| Hawaiians | 7.2 /100 | #213 | Tragic 17.6% |
| Immigrants | El Salvador | 7.0 /100 | #214 | Tragic 17.6% |
| Alaskan Athabascans | 6.9 /100 | #215 | Tragic 17.6% |
| Okinawans | 6.8 /100 | #216 | Tragic 17.6% |
| Salvadorans | 6.7 /100 | #217 | Tragic 17.6% |
| Icelanders | 6.4 /100 | #218 | Tragic 17.6% |
| Immigrants | Sierra Leone | 6.3 /100 | #219 | Tragic 17.6% |
| Zimbabweans | 6.1 /100 | #220 | Tragic 17.6% |
| Moroccans | 5.9 /100 | #221 | Tragic 17.6% |
| Central Americans | 4.5 /100 | #222 | Tragic 17.7% |
| Alsatians | 4.5 /100 | #223 | Tragic 17.7% |
| Fijians | 3.4 /100 | #224 | Tragic 17.7% |
| Vietnamese | 3.4 /100 | #225 | Tragic 17.7% |