Italian vs Icelander Cognitive Disability
COMPARE
Italian
Icelander
Cognitive Disability
Cognitive Disability Comparison
Italians
Icelanders
16.4%
COGNITIVE DISABILITY
99.9/ 100
METRIC RATING
33rd/ 347
METRIC RANK
17.6%
COGNITIVE DISABILITY
6.4/ 100
METRIC RATING
218th/ 347
METRIC RANK
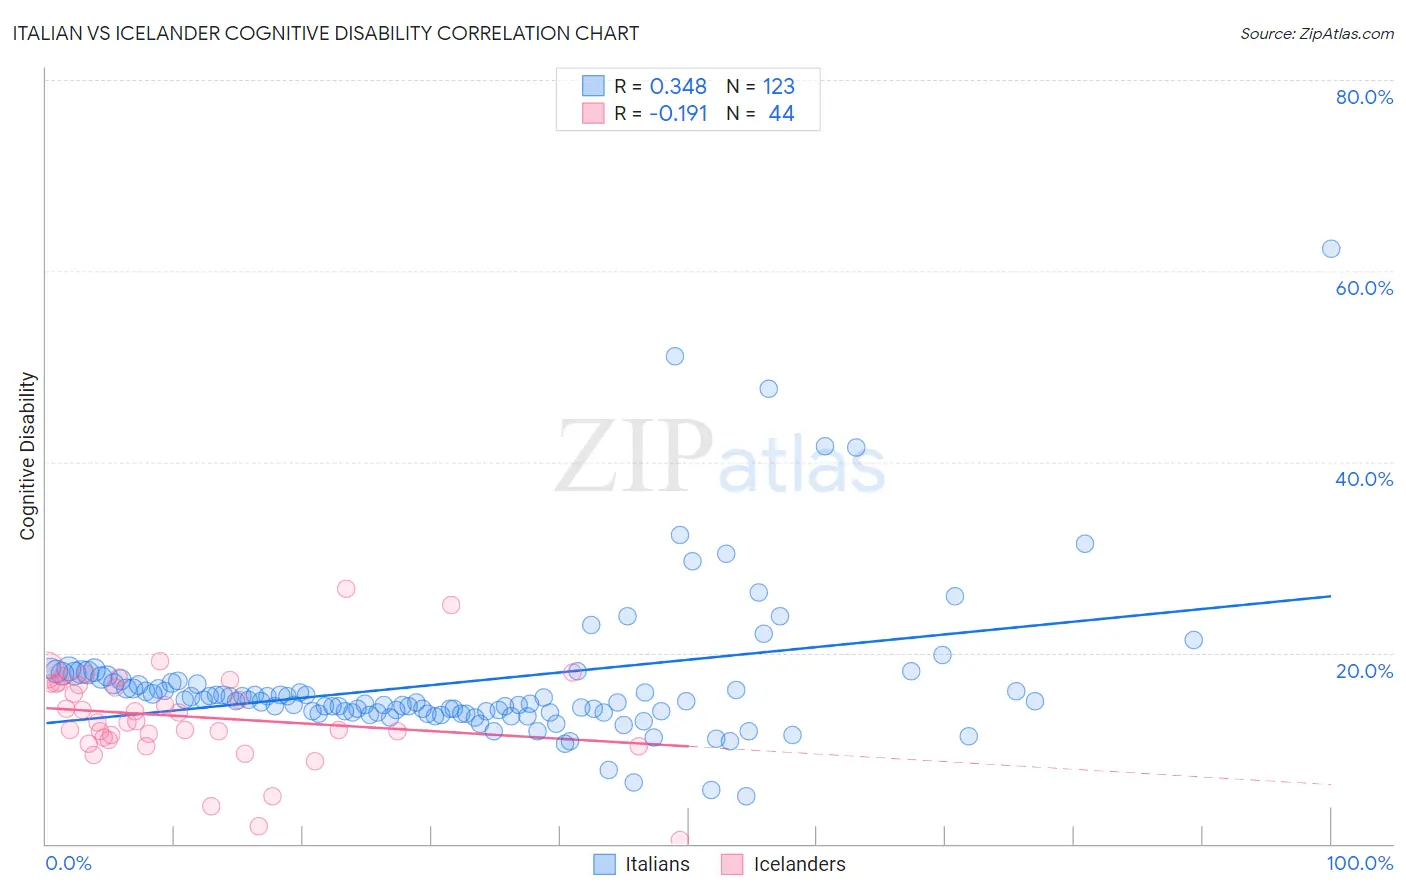
Italian vs Icelander Cognitive Disability Correlation Chart
The statistical analysis conducted on geographies consisting of 574,911,788 people shows a mild positive correlation between the proportion of Italians and percentage of population with cognitive disability in the United States with a correlation coefficient (R) of 0.348 and weighted average of 16.4%. Similarly, the statistical analysis conducted on geographies consisting of 159,644,345 people shows a poor negative correlation between the proportion of Icelanders and percentage of population with cognitive disability in the United States with a correlation coefficient (R) of -0.191 and weighted average of 17.6%, a difference of 7.3%.
Cognitive Disability Correlation Summary
| Measurement | Italian | Icelander |
| Minimum | 4.9% | 0.44% |
| Maximum | 62.3% | 26.7% |
| Range | 57.4% | 26.3% |
| Mean | 16.9% | 13.3% |
| Median | 15.0% | 12.8% |
| Interquartile 25% (IQ1) | 13.7% | 11.0% |
| Interquartile 75% (IQ3) | 17.1% | 16.8% |
| Interquartile Range (IQR) | 3.3% | 5.7% |
| Standard Deviation (Sample) | 8.0% | 5.1% |
| Standard Deviation (Population) | 8.0% | 5.0% |
Similar Demographics by Cognitive Disability
Demographics Similar to Italians by Cognitive Disability
In terms of cognitive disability, the demographic groups most similar to Italians are Russian (16.4%, a difference of 0.0%), Immigrants from Israel (16.4%, a difference of 0.070%), Slovak (16.4%, a difference of 0.080%), Greek (16.4%, a difference of 0.090%), and Immigrants from Romania (16.4%, a difference of 0.13%).
| Demographics | Rating | Rank | Cognitive Disability |
| Immigrants | Croatia | 99.9 /100 | #26 | Exceptional 16.4% |
| Immigrants | Pakistan | 99.9 /100 | #27 | Exceptional 16.4% |
| Poles | 99.9 /100 | #28 | Exceptional 16.4% |
| Filipinos | 99.9 /100 | #29 | Exceptional 16.4% |
| Czechs | 99.9 /100 | #30 | Exceptional 16.4% |
| Immigrants | Romania | 99.9 /100 | #31 | Exceptional 16.4% |
| Immigrants | Israel | 99.9 /100 | #32 | Exceptional 16.4% |
| Italians | 99.9 /100 | #33 | Exceptional 16.4% |
| Russians | 99.9 /100 | #34 | Exceptional 16.4% |
| Slovaks | 99.9 /100 | #35 | Exceptional 16.4% |
| Greeks | 99.9 /100 | #36 | Exceptional 16.4% |
| Slovenes | 99.9 /100 | #37 | Exceptional 16.5% |
| Immigrants | Eastern Europe | 99.9 /100 | #38 | Exceptional 16.5% |
| Bolivians | 99.9 /100 | #39 | Exceptional 16.5% |
| Immigrants | Belarus | 99.9 /100 | #40 | Exceptional 16.5% |
Demographics Similar to Icelanders by Cognitive Disability
In terms of cognitive disability, the demographic groups most similar to Icelanders are Immigrants from Sierra Leone (17.6%, a difference of 0.010%), Salvadoran (17.6%, a difference of 0.030%), Zimbabwean (17.6%, a difference of 0.040%), Okinawan (17.6%, a difference of 0.050%), and Moroccan (17.6%, a difference of 0.050%).
| Demographics | Rating | Rank | Cognitive Disability |
| Taiwanese | 7.7 /100 | #211 | Tragic 17.6% |
| Immigrants | Oceania | 7.3 /100 | #212 | Tragic 17.6% |
| Hawaiians | 7.2 /100 | #213 | Tragic 17.6% |
| Immigrants | El Salvador | 7.0 /100 | #214 | Tragic 17.6% |
| Alaskan Athabascans | 6.9 /100 | #215 | Tragic 17.6% |
| Okinawans | 6.8 /100 | #216 | Tragic 17.6% |
| Salvadorans | 6.7 /100 | #217 | Tragic 17.6% |
| Icelanders | 6.4 /100 | #218 | Tragic 17.6% |
| Immigrants | Sierra Leone | 6.3 /100 | #219 | Tragic 17.6% |
| Zimbabweans | 6.1 /100 | #220 | Tragic 17.6% |
| Moroccans | 5.9 /100 | #221 | Tragic 17.6% |
| Central Americans | 4.5 /100 | #222 | Tragic 17.7% |
| Alsatians | 4.5 /100 | #223 | Tragic 17.7% |
| Fijians | 3.4 /100 | #224 | Tragic 17.7% |
| Vietnamese | 3.4 /100 | #225 | Tragic 17.7% |