Canadian vs Czech Cognitive Disability
COMPARE
Canadian
Czech
Cognitive Disability
Cognitive Disability Comparison
Canadians
Czechs
16.8%
COGNITIVE DISABILITY
97.5/ 100
METRIC RATING
108th/ 347
METRIC RANK
16.4%
COGNITIVE DISABILITY
99.9/ 100
METRIC RATING
30th/ 347
METRIC RANK
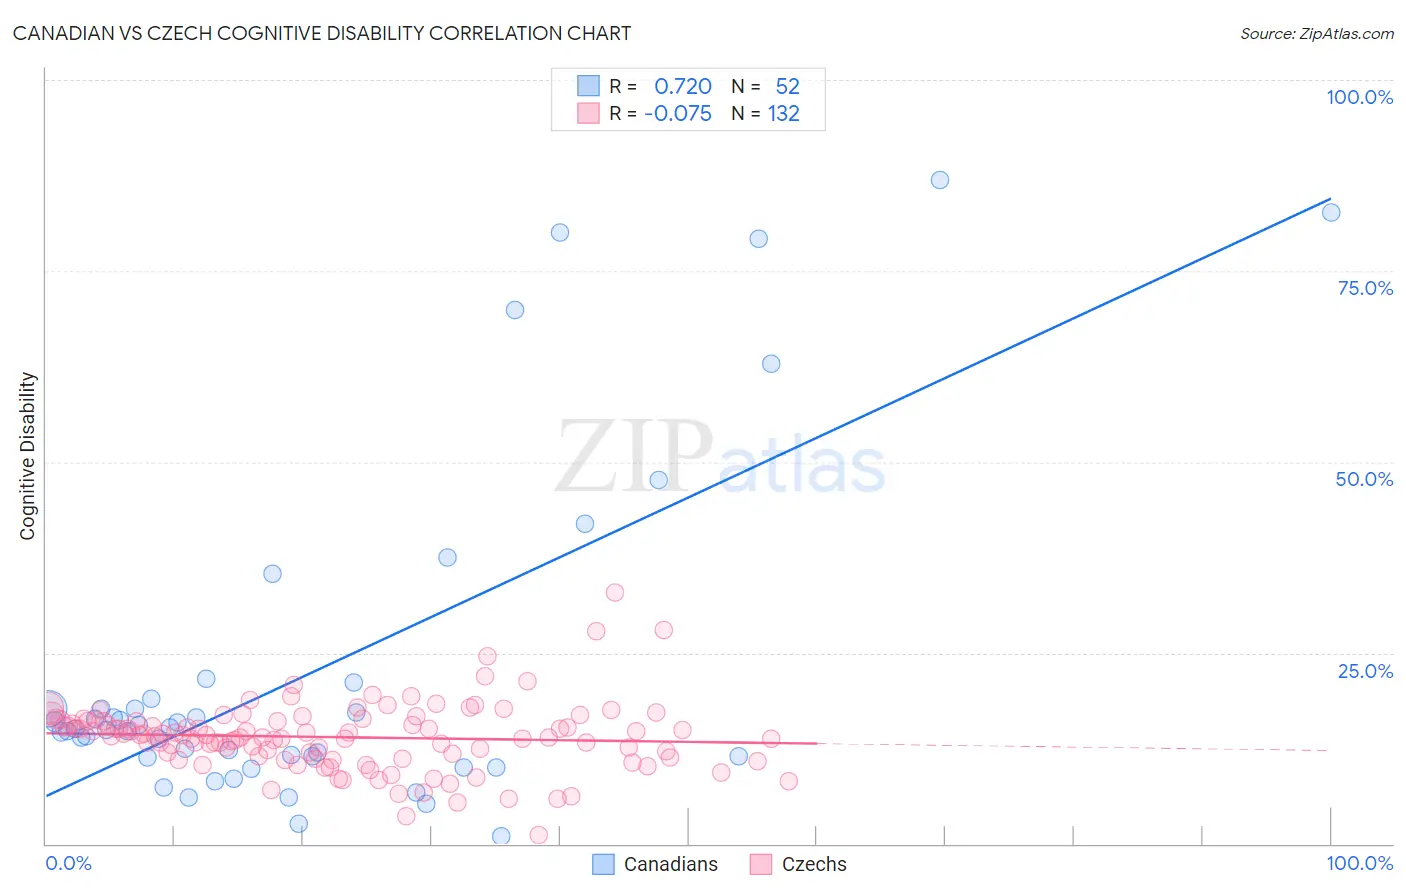
Canadian vs Czech Cognitive Disability Correlation Chart
The statistical analysis conducted on geographies consisting of 437,506,516 people shows a strong positive correlation between the proportion of Canadians and percentage of population with cognitive disability in the United States with a correlation coefficient (R) of 0.720 and weighted average of 16.8%. Similarly, the statistical analysis conducted on geographies consisting of 484,743,035 people shows a slight negative correlation between the proportion of Czechs and percentage of population with cognitive disability in the United States with a correlation coefficient (R) of -0.075 and weighted average of 16.4%, a difference of 2.7%.
Cognitive Disability Correlation Summary
| Measurement | Canadian | Czech |
| Minimum | 1.0% | 1.2% |
| Maximum | 87.0% | 32.9% |
| Range | 85.9% | 31.7% |
| Mean | 22.4% | 14.0% |
| Median | 15.0% | 14.1% |
| Interquartile 25% (IQ1) | 11.3% | 11.4% |
| Interquartile 75% (IQ3) | 18.4% | 16.0% |
| Interquartile Range (IQR) | 7.1% | 4.6% |
| Standard Deviation (Sample) | 21.9% | 4.4% |
| Standard Deviation (Population) | 21.7% | 4.4% |
Similar Demographics by Cognitive Disability
Demographics Similar to Canadians by Cognitive Disability
In terms of cognitive disability, the demographic groups most similar to Canadians are Albanian (16.8%, a difference of 0.050%), Arapaho (16.8%, a difference of 0.060%), Uruguayan (16.8%, a difference of 0.070%), Immigrants from Nicaragua (16.8%, a difference of 0.090%), and Indian (Asian) (16.8%, a difference of 0.090%).
| Demographics | Rating | Rank | Cognitive Disability |
| Immigrants | Asia | 98.1 /100 | #101 | Exceptional 16.8% |
| Irish | 98.1 /100 | #102 | Exceptional 16.8% |
| Paraguayans | 98.0 /100 | #103 | Exceptional 16.8% |
| Palestinians | 98.0 /100 | #104 | Exceptional 16.8% |
| Immigrants | Eastern Asia | 97.9 /100 | #105 | Exceptional 16.8% |
| Northern Europeans | 97.8 /100 | #106 | Exceptional 16.8% |
| Immigrants | Nicaragua | 97.8 /100 | #107 | Exceptional 16.8% |
| Canadians | 97.5 /100 | #108 | Exceptional 16.8% |
| Albanians | 97.3 /100 | #109 | Exceptional 16.8% |
| Arapaho | 97.3 /100 | #110 | Exceptional 16.8% |
| Uruguayans | 97.2 /100 | #111 | Exceptional 16.8% |
| Indians (Asian) | 97.2 /100 | #112 | Exceptional 16.8% |
| Immigrants | Sri Lanka | 97.1 /100 | #113 | Exceptional 16.8% |
| Koreans | 97.1 /100 | #114 | Exceptional 16.8% |
| Yup'ik | 96.9 /100 | #115 | Exceptional 16.9% |
Demographics Similar to Czechs by Cognitive Disability
In terms of cognitive disability, the demographic groups most similar to Czechs are Filipino (16.4%, a difference of 0.0%), Immigrants from Romania (16.4%, a difference of 0.020%), Immigrants from Pakistan (16.4%, a difference of 0.030%), Polish (16.4%, a difference of 0.030%), and Immigrants from Croatia (16.4%, a difference of 0.050%).
| Demographics | Rating | Rank | Cognitive Disability |
| Croatians | 99.9 /100 | #23 | Exceptional 16.4% |
| Immigrants | Argentina | 99.9 /100 | #24 | Exceptional 16.4% |
| Luxembourgers | 99.9 /100 | #25 | Exceptional 16.4% |
| Immigrants | Croatia | 99.9 /100 | #26 | Exceptional 16.4% |
| Immigrants | Pakistan | 99.9 /100 | #27 | Exceptional 16.4% |
| Poles | 99.9 /100 | #28 | Exceptional 16.4% |
| Filipinos | 99.9 /100 | #29 | Exceptional 16.4% |
| Czechs | 99.9 /100 | #30 | Exceptional 16.4% |
| Immigrants | Romania | 99.9 /100 | #31 | Exceptional 16.4% |
| Immigrants | Israel | 99.9 /100 | #32 | Exceptional 16.4% |
| Italians | 99.9 /100 | #33 | Exceptional 16.4% |
| Russians | 99.9 /100 | #34 | Exceptional 16.4% |
| Slovaks | 99.9 /100 | #35 | Exceptional 16.4% |
| Greeks | 99.9 /100 | #36 | Exceptional 16.4% |
| Slovenes | 99.9 /100 | #37 | Exceptional 16.5% |