Immigrants from Turkey vs Icelander Cognitive Disability
COMPARE
Immigrants from Turkey
Icelander
Cognitive Disability
Cognitive Disability Comparison
Immigrants from Turkey
Icelanders
17.2%
COGNITIVE DISABILITY
56.7/ 100
METRIC RATING
172nd/ 347
METRIC RANK
17.6%
COGNITIVE DISABILITY
6.4/ 100
METRIC RATING
218th/ 347
METRIC RANK
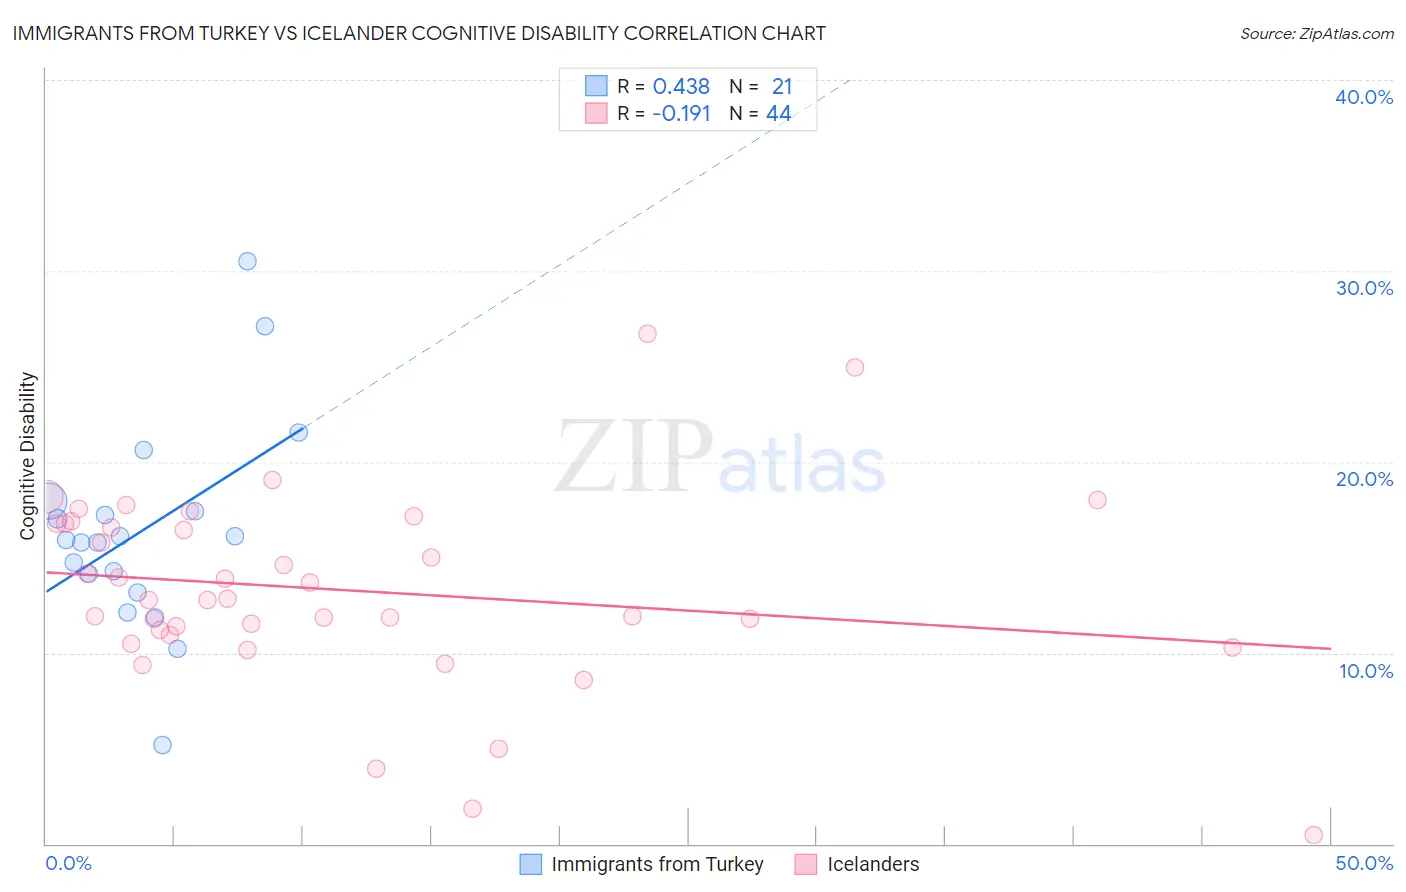
Immigrants from Turkey vs Icelander Cognitive Disability Correlation Chart
The statistical analysis conducted on geographies consisting of 223,051,603 people shows a moderate positive correlation between the proportion of Immigrants from Turkey and percentage of population with cognitive disability in the United States with a correlation coefficient (R) of 0.438 and weighted average of 17.2%. Similarly, the statistical analysis conducted on geographies consisting of 159,644,345 people shows a poor negative correlation between the proportion of Icelanders and percentage of population with cognitive disability in the United States with a correlation coefficient (R) of -0.191 and weighted average of 17.6%, a difference of 2.1%.
Cognitive Disability Correlation Summary
| Measurement | Immigrants from Turkey | Icelander |
| Minimum | 5.2% | 0.44% |
| Maximum | 30.5% | 26.7% |
| Range | 25.3% | 26.3% |
| Mean | 16.4% | 13.3% |
| Median | 15.9% | 12.8% |
| Interquartile 25% (IQ1) | 13.7% | 11.0% |
| Interquartile 75% (IQ3) | 17.7% | 16.8% |
| Interquartile Range (IQR) | 4.0% | 5.7% |
| Standard Deviation (Sample) | 5.4% | 5.1% |
| Standard Deviation (Population) | 5.3% | 5.0% |
Similar Demographics by Cognitive Disability
Demographics Similar to Immigrants from Turkey by Cognitive Disability
In terms of cognitive disability, the demographic groups most similar to Immigrants from Turkey are Tlingit-Haida (17.2%, a difference of 0.080%), Ecuadorian (17.2%, a difference of 0.090%), Immigrants from Portugal (17.2%, a difference of 0.15%), Immigrants (17.2%, a difference of 0.17%), and Immigrants from Northern Africa (17.3%, a difference of 0.18%).
| Demographics | Rating | Rank | Cognitive Disability |
| Immigrants | Albania | 64.9 /100 | #165 | Good 17.2% |
| Immigrants | Ecuador | 64.4 /100 | #166 | Good 17.2% |
| Immigrants | Syria | 63.5 /100 | #167 | Good 17.2% |
| Immigrants | Immigrants | 62.5 /100 | #168 | Good 17.2% |
| Immigrants | Portugal | 61.8 /100 | #169 | Good 17.2% |
| Ecuadorians | 59.6 /100 | #170 | Average 17.2% |
| Tlingit-Haida | 59.4 /100 | #171 | Average 17.2% |
| Immigrants | Turkey | 56.7 /100 | #172 | Average 17.2% |
| Immigrants | Northern Africa | 50.2 /100 | #173 | Average 17.3% |
| Laotians | 50.0 /100 | #174 | Average 17.3% |
| Tsimshian | 49.8 /100 | #175 | Average 17.3% |
| Shoshone | 49.2 /100 | #176 | Average 17.3% |
| Ute | 49.1 /100 | #177 | Average 17.3% |
| Spanish | 48.9 /100 | #178 | Average 17.3% |
| Sioux | 48.6 /100 | #179 | Average 17.3% |
Demographics Similar to Icelanders by Cognitive Disability
In terms of cognitive disability, the demographic groups most similar to Icelanders are Immigrants from Sierra Leone (17.6%, a difference of 0.010%), Salvadoran (17.6%, a difference of 0.030%), Zimbabwean (17.6%, a difference of 0.040%), Okinawan (17.6%, a difference of 0.050%), and Moroccan (17.6%, a difference of 0.050%).
| Demographics | Rating | Rank | Cognitive Disability |
| Taiwanese | 7.7 /100 | #211 | Tragic 17.6% |
| Immigrants | Oceania | 7.3 /100 | #212 | Tragic 17.6% |
| Hawaiians | 7.2 /100 | #213 | Tragic 17.6% |
| Immigrants | El Salvador | 7.0 /100 | #214 | Tragic 17.6% |
| Alaskan Athabascans | 6.9 /100 | #215 | Tragic 17.6% |
| Okinawans | 6.8 /100 | #216 | Tragic 17.6% |
| Salvadorans | 6.7 /100 | #217 | Tragic 17.6% |
| Icelanders | 6.4 /100 | #218 | Tragic 17.6% |
| Immigrants | Sierra Leone | 6.3 /100 | #219 | Tragic 17.6% |
| Zimbabweans | 6.1 /100 | #220 | Tragic 17.6% |
| Moroccans | 5.9 /100 | #221 | Tragic 17.6% |
| Central Americans | 4.5 /100 | #222 | Tragic 17.7% |
| Alsatians | 4.5 /100 | #223 | Tragic 17.7% |
| Fijians | 3.4 /100 | #224 | Tragic 17.7% |
| Vietnamese | 3.4 /100 | #225 | Tragic 17.7% |