Cambodian vs Blackfeet Male Disability
COMPARE
Cambodian
Blackfeet
Male Disability
Male Disability Comparison
Cambodians
Blackfeet
10.3%
MALE DISABILITY
99.7/ 100
METRIC RATING
46th/ 347
METRIC RANK
13.4%
MALE DISABILITY
0.0/ 100
METRIC RATING
309th/ 347
METRIC RANK
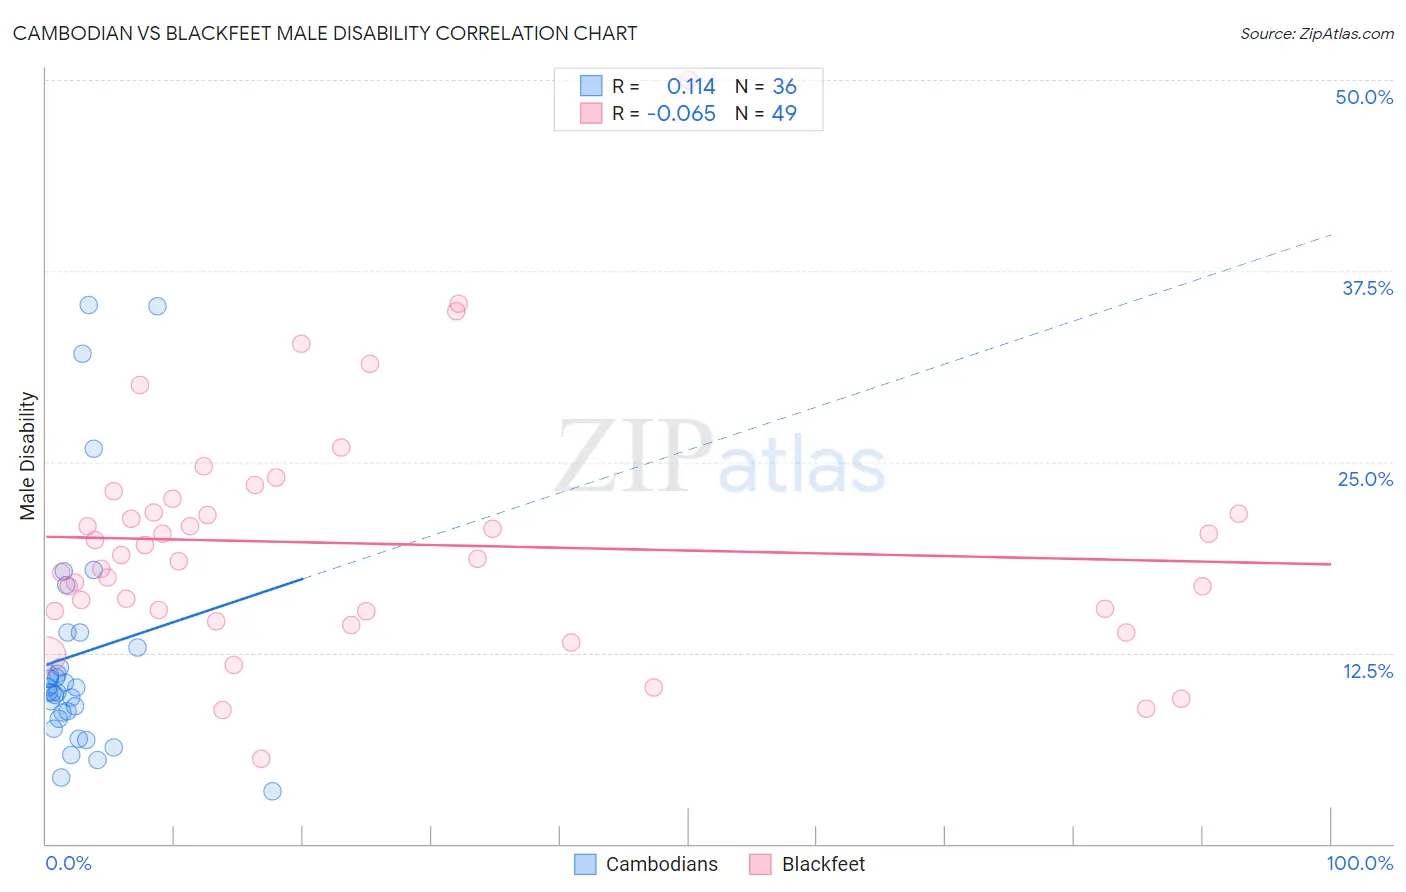
Cambodian vs Blackfeet Male Disability Correlation Chart
The statistical analysis conducted on geographies consisting of 102,516,296 people shows a poor positive correlation between the proportion of Cambodians and percentage of males with a disability in the United States with a correlation coefficient (R) of 0.114 and weighted average of 10.3%. Similarly, the statistical analysis conducted on geographies consisting of 309,505,092 people shows a slight negative correlation between the proportion of Blackfeet and percentage of males with a disability in the United States with a correlation coefficient (R) of -0.065 and weighted average of 13.4%, a difference of 30.1%.
Male Disability Correlation Summary
| Measurement | Cambodian | Blackfeet |
| Minimum | 3.5% | 5.6% |
| Maximum | 35.3% | 50.0% |
| Range | 31.8% | 44.4% |
| Mean | 12.4% | 19.6% |
| Median | 10.1% | 18.6% |
| Interquartile 25% (IQ1) | 8.4% | 15.2% |
| Interquartile 75% (IQ3) | 13.4% | 22.2% |
| Interquartile Range (IQR) | 4.9% | 6.9% |
| Standard Deviation (Sample) | 7.9% | 7.9% |
| Standard Deviation (Population) | 7.8% | 7.8% |
Similar Demographics by Male Disability
Demographics Similar to Cambodians by Male Disability
In terms of male disability, the demographic groups most similar to Cambodians are Immigrants from Peru (10.3%, a difference of 0.040%), Israeli (10.3%, a difference of 0.070%), Turkish (10.3%, a difference of 0.080%), Immigrants from El Salvador (10.3%, a difference of 0.090%), and Immigrants from Spain (10.3%, a difference of 0.13%).
| Demographics | Rating | Rank | Male Disability |
| Afghans | 99.8 /100 | #39 | Exceptional 10.2% |
| Immigrants | Nepal | 99.8 /100 | #40 | Exceptional 10.3% |
| Taiwanese | 99.8 /100 | #41 | Exceptional 10.3% |
| Mongolians | 99.7 /100 | #42 | Exceptional 10.3% |
| Immigrants | Bangladesh | 99.7 /100 | #43 | Exceptional 10.3% |
| Immigrants | El Salvador | 99.7 /100 | #44 | Exceptional 10.3% |
| Turks | 99.7 /100 | #45 | Exceptional 10.3% |
| Cambodians | 99.7 /100 | #46 | Exceptional 10.3% |
| Immigrants | Peru | 99.7 /100 | #47 | Exceptional 10.3% |
| Israelis | 99.7 /100 | #48 | Exceptional 10.3% |
| Immigrants | Spain | 99.7 /100 | #49 | Exceptional 10.3% |
| South Americans | 99.6 /100 | #50 | Exceptional 10.3% |
| Salvadorans | 99.6 /100 | #51 | Exceptional 10.4% |
| Immigrants | Saudi Arabia | 99.6 /100 | #52 | Exceptional 10.4% |
| Immigrants | Uzbekistan | 99.6 /100 | #53 | Exceptional 10.4% |
Demographics Similar to Blackfeet by Male Disability
In terms of male disability, the demographic groups most similar to Blackfeet are Immigrants from the Azores (13.4%, a difference of 0.14%), Delaware (13.5%, a difference of 0.33%), French American Indian (13.4%, a difference of 0.42%), Arapaho (13.3%, a difference of 0.58%), and Spanish American (13.3%, a difference of 0.80%).
| Demographics | Rating | Rank | Male Disability |
| Crow | 0.0 /100 | #302 | Tragic 13.1% |
| Scotch-Irish | 0.0 /100 | #303 | Tragic 13.2% |
| Blacks/African Americans | 0.0 /100 | #304 | Tragic 13.2% |
| French Canadians | 0.0 /100 | #305 | Tragic 13.3% |
| Spanish Americans | 0.0 /100 | #306 | Tragic 13.3% |
| Arapaho | 0.0 /100 | #307 | Tragic 13.3% |
| French American Indians | 0.0 /100 | #308 | Tragic 13.4% |
| Blackfeet | 0.0 /100 | #309 | Tragic 13.4% |
| Immigrants | Azores | 0.0 /100 | #310 | Tragic 13.4% |
| Delaware | 0.0 /100 | #311 | Tragic 13.5% |
| Yakama | 0.0 /100 | #312 | Tragic 13.5% |
| Puget Sound Salish | 0.0 /100 | #313 | Tragic 13.5% |
| Aleuts | 0.0 /100 | #314 | Tragic 13.5% |
| Iroquois | 0.0 /100 | #315 | Tragic 13.6% |
| Alaska Natives | 0.0 /100 | #316 | Tragic 13.6% |