Immigrants from Hong Kong vs Immigrants from Moldova Male Disability
COMPARE
Immigrants from Hong Kong
Immigrants from Moldova
Male Disability
Male Disability Comparison
Immigrants from Hong Kong
Immigrants from Moldova
9.4%
MALE DISABILITY
100.0/ 100
METRIC RATING
5th/ 347
METRIC RANK
11.1%
MALE DISABILITY
72.8/ 100
METRIC RATING
154th/ 347
METRIC RANK
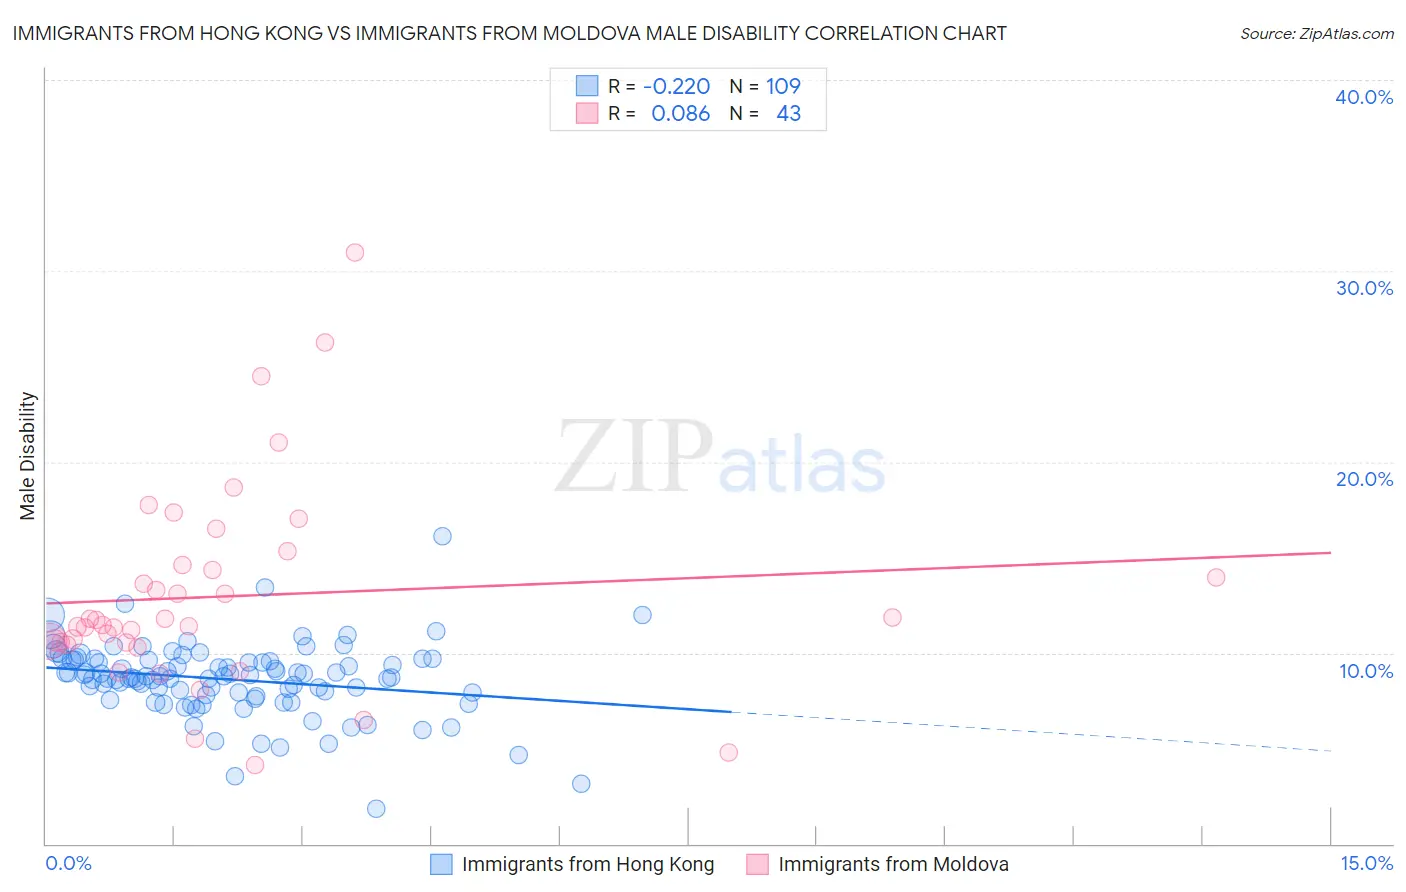
Immigrants from Hong Kong vs Immigrants from Moldova Male Disability Correlation Chart
The statistical analysis conducted on geographies consisting of 253,984,960 people shows a weak negative correlation between the proportion of Immigrants from Hong Kong and percentage of males with a disability in the United States with a correlation coefficient (R) of -0.220 and weighted average of 9.4%. Similarly, the statistical analysis conducted on geographies consisting of 124,384,403 people shows a slight positive correlation between the proportion of Immigrants from Moldova and percentage of males with a disability in the United States with a correlation coefficient (R) of 0.086 and weighted average of 11.1%, a difference of 17.4%.
Male Disability Correlation Summary
| Measurement | Immigrants from Hong Kong | Immigrants from Moldova |
| Minimum | 1.8% | 4.1% |
| Maximum | 16.1% | 31.0% |
| Range | 14.3% | 26.8% |
| Mean | 8.6% | 13.0% |
| Median | 8.7% | 11.5% |
| Interquartile 25% (IQ1) | 7.8% | 10.5% |
| Interquartile 75% (IQ3) | 9.6% | 14.6% |
| Interquartile Range (IQR) | 1.9% | 4.1% |
| Standard Deviation (Sample) | 2.0% | 5.3% |
| Standard Deviation (Population) | 1.9% | 5.3% |
Similar Demographics by Male Disability
Demographics Similar to Immigrants from Hong Kong by Male Disability
In terms of male disability, the demographic groups most similar to Immigrants from Hong Kong are Immigrants from South Central Asia (9.4%, a difference of 0.060%), Immigrants from Bolivia (9.5%, a difference of 0.39%), Immigrants from China (9.5%, a difference of 0.99%), Immigrants from Singapore (9.5%, a difference of 1.1%), and Immigrants from Israel (9.6%, a difference of 1.5%).
| Demographics | Rating | Rank | Male Disability |
| Immigrants | India | 100.0 /100 | #1 | Exceptional 9.0% |
| Immigrants | Taiwan | 100.0 /100 | #2 | Exceptional 9.1% |
| Filipinos | 100.0 /100 | #3 | Exceptional 9.1% |
| Thais | 100.0 /100 | #4 | Exceptional 9.2% |
| Immigrants | Hong Kong | 100.0 /100 | #5 | Exceptional 9.4% |
| Immigrants | South Central Asia | 100.0 /100 | #6 | Exceptional 9.4% |
| Immigrants | Bolivia | 100.0 /100 | #7 | Exceptional 9.5% |
| Immigrants | China | 100.0 /100 | #8 | Exceptional 9.5% |
| Immigrants | Singapore | 100.0 /100 | #9 | Exceptional 9.5% |
| Immigrants | Israel | 100.0 /100 | #10 | Exceptional 9.6% |
| Immigrants | Eastern Asia | 100.0 /100 | #11 | Exceptional 9.6% |
| Bolivians | 100.0 /100 | #12 | Exceptional 9.6% |
| Iranians | 100.0 /100 | #13 | Exceptional 9.7% |
| Immigrants | Iran | 100.0 /100 | #14 | Exceptional 9.7% |
| Indians (Asian) | 100.0 /100 | #15 | Exceptional 9.7% |
Demographics Similar to Immigrants from Moldova by Male Disability
In terms of male disability, the demographic groups most similar to Immigrants from Moldova are Immigrants from Northern Europe (11.1%, a difference of 0.020%), Immigrants from Albania (11.0%, a difference of 0.11%), Immigrants from Middle Africa (11.1%, a difference of 0.14%), Cuban (11.0%, a difference of 0.15%), and Immigrants from Guatemala (11.0%, a difference of 0.17%).
| Demographics | Rating | Rank | Male Disability |
| Immigrants | Croatia | 77.3 /100 | #147 | Good 11.0% |
| Sudanese | 77.1 /100 | #148 | Good 11.0% |
| Immigrants | Denmark | 76.4 /100 | #149 | Good 11.0% |
| Immigrants | Guatemala | 75.1 /100 | #150 | Good 11.0% |
| Cubans | 74.9 /100 | #151 | Good 11.0% |
| Immigrants | Albania | 74.4 /100 | #152 | Good 11.0% |
| Immigrants | Northern Europe | 73.2 /100 | #153 | Good 11.1% |
| Immigrants | Moldova | 72.8 /100 | #154 | Good 11.1% |
| Immigrants | Middle Africa | 70.9 /100 | #155 | Good 11.1% |
| Russians | 69.8 /100 | #156 | Good 11.1% |
| Immigrants | Western Africa | 69.2 /100 | #157 | Good 11.1% |
| Latvians | 68.1 /100 | #158 | Good 11.1% |
| Guatemalans | 67.2 /100 | #159 | Good 11.1% |
| Albanians | 66.5 /100 | #160 | Good 11.1% |
| Immigrants | West Indies | 65.7 /100 | #161 | Good 11.1% |