Cajun vs Ugandan Self-Care Disability
COMPARE
Cajun
Ugandan
Self-Care Disability
Self-Care Disability Comparison
Cajuns
Ugandans
2.9%
SELF-CARE DISABILITY
0.0/ 100
METRIC RATING
329th/ 347
METRIC RANK
2.3%
SELF-CARE DISABILITY
98.8/ 100
METRIC RATING
81st/ 347
METRIC RANK
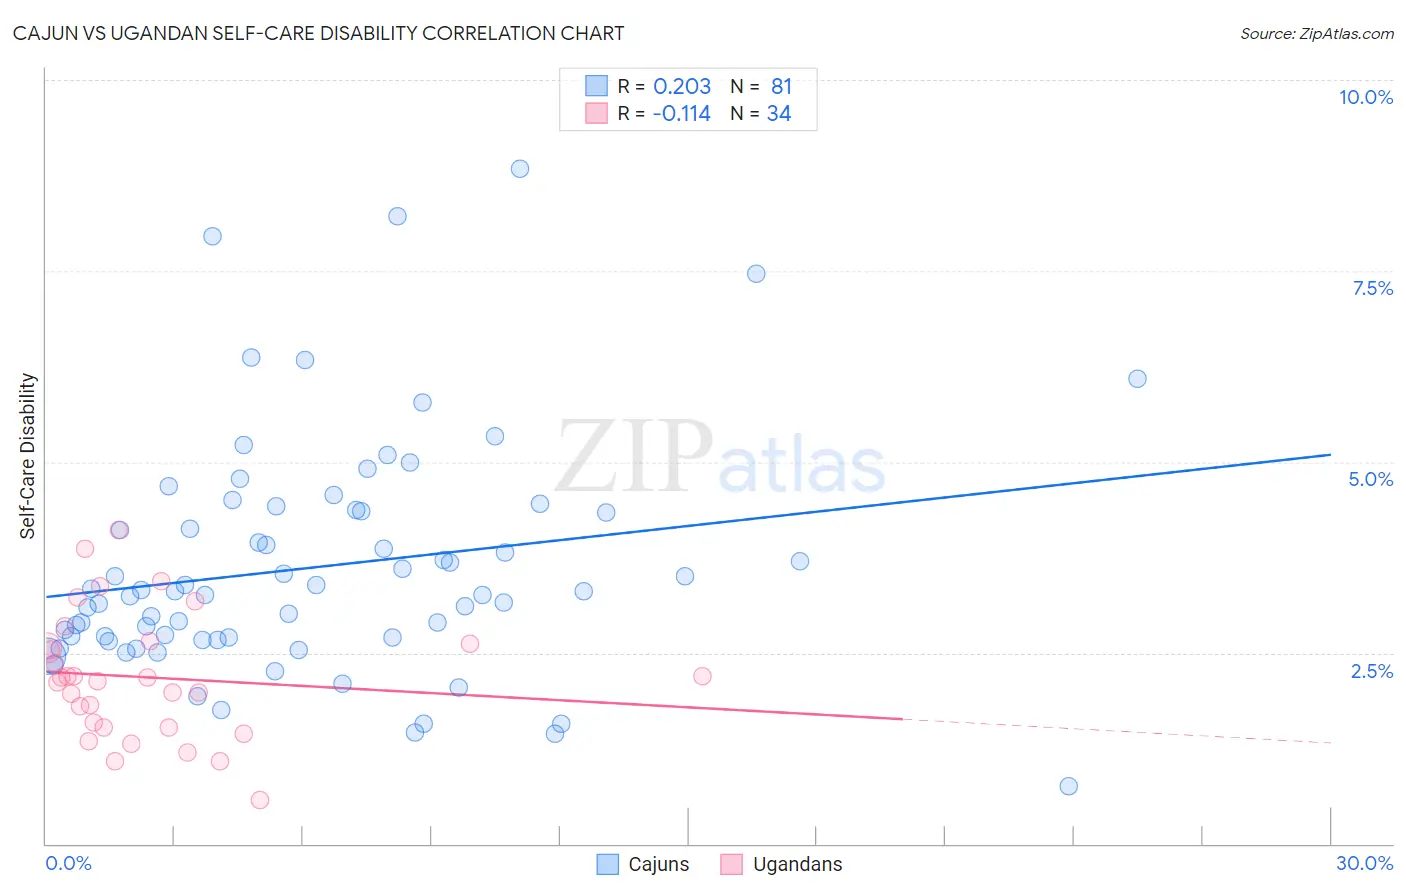
Cajun vs Ugandan Self-Care Disability Correlation Chart
The statistical analysis conducted on geographies consisting of 149,634,207 people shows a weak positive correlation between the proportion of Cajuns and percentage of population with self-care disability in the United States with a correlation coefficient (R) of 0.203 and weighted average of 2.9%. Similarly, the statistical analysis conducted on geographies consisting of 93,977,399 people shows a poor negative correlation between the proportion of Ugandans and percentage of population with self-care disability in the United States with a correlation coefficient (R) of -0.114 and weighted average of 2.3%, a difference of 25.8%.
Self-Care Disability Correlation Summary
| Measurement | Cajun | Ugandan |
| Minimum | 0.75% | 0.57% |
| Maximum | 8.8% | 4.1% |
| Range | 8.1% | 3.5% |
| Mean | 3.6% | 2.2% |
| Median | 3.3% | 2.2% |
| Interquartile 25% (IQ1) | 2.7% | 1.5% |
| Interquartile 75% (IQ3) | 4.4% | 2.6% |
| Interquartile Range (IQR) | 1.7% | 1.1% |
| Standard Deviation (Sample) | 1.5% | 0.82% |
| Standard Deviation (Population) | 1.5% | 0.81% |
Similar Demographics by Self-Care Disability
Demographics Similar to Cajuns by Self-Care Disability
In terms of self-care disability, the demographic groups most similar to Cajuns are Hopi (2.9%, a difference of 0.21%), Black/African American (2.9%, a difference of 0.60%), Paiute (2.9%, a difference of 0.67%), Nepalese (3.0%, a difference of 0.75%), and Lumbee (3.0%, a difference of 0.87%).
| Demographics | Rating | Rank | Self-Care Disability |
| Comanche | 0.0 /100 | #322 | Tragic 2.9% |
| Seminole | 0.0 /100 | #323 | Tragic 2.9% |
| Cherokee | 0.0 /100 | #324 | Tragic 2.9% |
| Immigrants | Uzbekistan | 0.0 /100 | #325 | Tragic 2.9% |
| Paiute | 0.0 /100 | #326 | Tragic 2.9% |
| Blacks/African Americans | 0.0 /100 | #327 | Tragic 2.9% |
| Hopi | 0.0 /100 | #328 | Tragic 2.9% |
| Cajuns | 0.0 /100 | #329 | Tragic 2.9% |
| Nepalese | 0.0 /100 | #330 | Tragic 3.0% |
| Lumbee | 0.0 /100 | #331 | Tragic 3.0% |
| Kiowa | 0.0 /100 | #332 | Tragic 3.0% |
| Dutch West Indians | 0.0 /100 | #333 | Tragic 3.0% |
| Houma | 0.0 /100 | #334 | Tragic 3.0% |
| Immigrants | Azores | 0.0 /100 | #335 | Tragic 3.0% |
| Immigrants | Yemen | 0.0 /100 | #336 | Tragic 3.0% |
Demographics Similar to Ugandans by Self-Care Disability
In terms of self-care disability, the demographic groups most similar to Ugandans are Immigrants from Denmark (2.3%, a difference of 0.0%), Chilean (2.3%, a difference of 0.070%), Indian (Asian) (2.3%, a difference of 0.070%), Immigrants from Spain (2.3%, a difference of 0.11%), and Immigrants from Middle Africa (2.3%, a difference of 0.26%).
| Demographics | Rating | Rank | Self-Care Disability |
| Immigrants | Switzerland | 99.1 /100 | #74 | Exceptional 2.3% |
| Immigrants | Netherlands | 99.1 /100 | #75 | Exceptional 2.3% |
| Immigrants | China | 99.1 /100 | #76 | Exceptional 2.3% |
| Immigrants | Middle Africa | 99.0 /100 | #77 | Exceptional 2.3% |
| Immigrants | Ireland | 99.0 /100 | #78 | Exceptional 2.3% |
| Immigrants | Kenya | 99.0 /100 | #79 | Exceptional 2.3% |
| Chileans | 98.8 /100 | #80 | Exceptional 2.3% |
| Ugandans | 98.8 /100 | #81 | Exceptional 2.3% |
| Immigrants | Denmark | 98.8 /100 | #82 | Exceptional 2.3% |
| Indians (Asian) | 98.7 /100 | #83 | Exceptional 2.3% |
| Immigrants | Spain | 98.7 /100 | #84 | Exceptional 2.3% |
| Estonians | 98.3 /100 | #85 | Exceptional 2.3% |
| Immigrants | Northern Africa | 98.2 /100 | #86 | Exceptional 2.3% |
| Sierra Leoneans | 98.0 /100 | #87 | Exceptional 2.4% |
| Lithuanians | 98.0 /100 | #88 | Exceptional 2.4% |