Immigrants from Barbados vs Carpatho Rusyn Disability Age Under 5

COMPARE

Immigrants from Barbados
Race
Ancestry
AfghanAfricanAlaska NativeAlaskan AthabascanAlbanianAleutAlsatianAmericanApacheArabArapahoArgentineanArmenianAssyrian/Chaldean/SyriacAustralianAustrianBahamianBangladeshiBarbadianBasqueBelgianBelizeanBermudanBhutaneseBlackfeetBolivianBrazilianBritishBritish West IndianBulgarianBurmeseCajunCambodianCanadianCape VerdeanCelticCentral AmericanCentral American IndianCherokeeCheyenneChickasawChileanChineseChippewaChoctawColombianColvilleComancheCosta RicanCreeCreekCroatianCrowCubanCypriotCzechCzechoslovakianDanishDelawareDominicanDutchDutch West IndianEastern EuropeanEcuadorianEgyptianEnglishEstonianEthiopianEuropeanFijianFilipinoFinnishFrenchFrench American IndianFrench CanadianGermanGerman RussianGhanaianGreekGuamanian/ChamorroGuatemalanGuyaneseHaitianHmongHonduranHopiHoumaHungarianIcelanderIndian (Asian)IndonesianInupiatIranianIraqiIrishIroquoisIsraeliItalianJamaicanJapaneseJordanianKenyanKiowaKoreanLaotianLatvianLebaneseLiberianLithuanianLumbeeLuxembourgerMacedonianMalaysianMalteseMarshalleseMenomineeMexicanMexican American IndianMongolianMoroccanNative HawaiianNavajoNepaleseNew ZealanderNicaraguanNigerianNorthern EuropeanNorwegianOkinawanOsageOttawaPaiutePakistaniPalestinianPanamanianParaguayanPennsylvania GermanPeruvianPimaPolishPortuguesePotawatomiPuebloPuerto RicanPuget Sound SalishRomanianRussianSalvadoranSamoanScandinavianScotch-IrishScottishSeminoleSenegaleseSerbianShoshoneSierra LeoneanSiouxSlavicSlovakSloveneSomaliSouth AfricanSouth AmericanSouth American IndianSoviet UnionSpaniardSpanishSpanish AmericanSpanish American IndianSri LankanSubsaharan AfricanSudaneseSwedishSwissSyrianTaiwaneseThaiTlingit-HaidaTohono O'OdhamTonganTrinidadian and TobagonianTsimshianTurkishU.S. Virgin IslanderUgandanUkrainianUruguayanUteVenezuelanVietnameseWelshWest IndianYakamaYaquiYugoslavianYumanYup'ikZimbabwean
Immigration
NonimmigrantsImmigrantsAfghanistanAfricaAlbaniaArgentinaArmeniaAsiaAustraliaAustriaBahamasBangladeshBarbadosBelarusBelgiumBelizeBoliviaBosnia and HerzegovinaBrazilBulgariaBurma/MyanmarCabo VerdeCambodiaCameroonCanadaCaribbeanCentral AmericaChileChinaColombiaCongoCosta RicaCroatiaCubaCzechoslovakiaDenmarkDominicaDominican RepublicEastern AfricaEastern AsiaEastern EuropeEcuadorEgyptEl SalvadorEnglandEritreaEthiopiaEuropeFijiFranceGermanyGhanaGreeceGrenadaGuatemalaGuyanaHaitiHondurasHong KongHungaryIndiaIndonesiaIranIraqIrelandIsraelItalyJamaicaJapanJordanKazakhstanKenyaKoreaKuwaitLaosLatin AmericaLatviaLebanonLiberiaLithuaniaMalaysiaMexicoMicronesiaMiddle AfricaMoldovaMoroccoNepalNetherlandsNicaraguaNigeriaNorth AmericaNorth MacedoniaNorthern AfricaNorthern EuropeNorwayOceaniaPakistanPanamaPeruPhilippinesPolandPortugalRomaniaRussiaSaudi ArabiaScotlandSenegalSerbiaSierra LeoneSingaporeSomaliaSouth AfricaSouth AmericaSouth Central AsiaSouth Eastern AsiaSouthern EuropeSpainSri LankaSt. Vincent and the GrenadinesSudanSwedenSwitzerlandSyriaTaiwanThailandTrinidad and TobagoTurkeyUgandaUkraineUruguayUzbekistanVenezuelaVietnamWest IndiesWestern AfricaWestern AsiaWestern EuropeYemenZaireZimbabweAzores
Carpatho Rusyn
Race
Ancestry
AfghanAfricanAlaska NativeAlaskan AthabascanAlbanianAleutAlsatianAmericanApacheArabArapahoArgentineanArmenianAssyrian/Chaldean/SyriacAustralianAustrianBahamianBangladeshiBarbadianBasqueBelgianBelizeanBermudanBhutaneseBlackfeetBolivianBrazilianBritishBritish West IndianBulgarianBurmeseCajunCambodianCanadianCape VerdeanCarpatho RusynCelticCentral AmericanCentral American IndianCherokeeCheyenneChickasawChileanChineseChippewaChoctawColombianColvilleComancheCosta RicanCreeCreekCroatianCrowCubanCypriotCzechCzechoslovakianDanishDelawareDominicanDutchDutch West IndianEastern EuropeanEcuadorianEgyptianEnglishEstonianEthiopianEuropeanFijianFilipinoFinnishFrenchFrench American IndianFrench CanadianGermanGerman RussianGhanaianGreekGuamanian/ChamorroGuatemalanGuyaneseHaitianHmongHonduranHopiHoumaHungarianIcelanderIndian (Asian)IndonesianInupiatIranianIraqiIrishIroquoisIsraeliItalianJamaicanJapaneseJordanianKenyanKiowaKoreanLaotianLatvianLebaneseLiberianLithuanianLumbeeLuxembourgerMacedonianMalaysianMalteseMarshalleseMenomineeMexicanMexican American IndianMongolianMoroccanNative HawaiianNavajoNepaleseNew ZealanderNicaraguanNigerianNorthern EuropeanNorwegianOkinawanOsageOttawaPaiutePakistaniPalestinianPanamanianParaguayanPennsylvania GermanPeruvianPimaPolishPortuguesePotawatomiPuebloPuerto RicanPuget Sound SalishRomanianRussianSalvadoranSamoanScandinavianScotch-IrishScottishSeminoleSenegaleseSerbianShoshoneSierra LeoneanSiouxSlavicSlovakSloveneSomaliSouth AfricanSouth AmericanSouth American IndianSoviet UnionSpaniardSpanishSpanish AmericanSpanish American IndianSri LankanSubsaharan AfricanSudaneseSwedishSwissSyrianTaiwaneseThaiTlingit-HaidaTohono O'OdhamTonganTrinidadian and TobagonianTsimshianTurkishU.S. Virgin IslanderUgandanUkrainianUruguayanUteVenezuelanVietnameseWelshWest IndianYakamaYaquiYugoslavianYumanYup'ikZimbabwean
Immigration
NonimmigrantsImmigrantsAfghanistanAfricaAlbaniaArgentinaArmeniaAsiaAustraliaAustriaBahamasBangladeshBelarusBelgiumBelizeBoliviaBosnia and HerzegovinaBrazilBulgariaBurma/MyanmarCabo VerdeCambodiaCameroonCanadaCaribbeanCentral AmericaChileChinaColombiaCongoCosta RicaCroatiaCubaCzechoslovakiaDenmarkDominicaDominican RepublicEastern AfricaEastern AsiaEastern EuropeEcuadorEgyptEl SalvadorEnglandEritreaEthiopiaEuropeFijiFranceGermanyGhanaGreeceGrenadaGuatemalaGuyanaHaitiHondurasHong KongHungaryIndiaIndonesiaIranIraqIrelandIsraelItalyJamaicaJapanJordanKazakhstanKenyaKoreaKuwaitLaosLatin AmericaLatviaLebanonLiberiaLithuaniaMalaysiaMexicoMicronesiaMiddle AfricaMoldovaMoroccoNepalNetherlandsNicaraguaNigeriaNorth AmericaNorth MacedoniaNorthern AfricaNorthern EuropeNorwayOceaniaPakistanPanamaPeruPhilippinesPolandPortugalRomaniaRussiaSaudi ArabiaScotlandSenegalSerbiaSierra LeoneSingaporeSomaliaSouth AfricaSouth AmericaSouth Central AsiaSouth Eastern AsiaSouthern EuropeSpainSri LankaSt. Vincent and the GrenadinesSudanSwedenSwitzerlandSyriaTaiwanThailandTrinidad and TobagoTurkeyUgandaUkraineUruguayUzbekistanVenezuelaVietnamWest IndiesWestern AfricaWestern AsiaWestern EuropeYemenZaireZimbabweAzores
Disability Age Under 5
Income
Poverty
Unemployment
Labor Participation
Family Structure
Vehicle Availability
Education Level
Disability

Disability Age Under 5 Comparison

Immigrants from Barbados

Carpatho Rusyns

Exceptional
Tragic
0.97%
DISABILITY AGE UNDER 5
100.0/ 100
METRIC RATING
18th/ 347
METRIC RANK
1.4%
DISABILITY AGE UNDER 5
0.1/ 100
METRIC RATING
265th/ 347
METRIC RANK

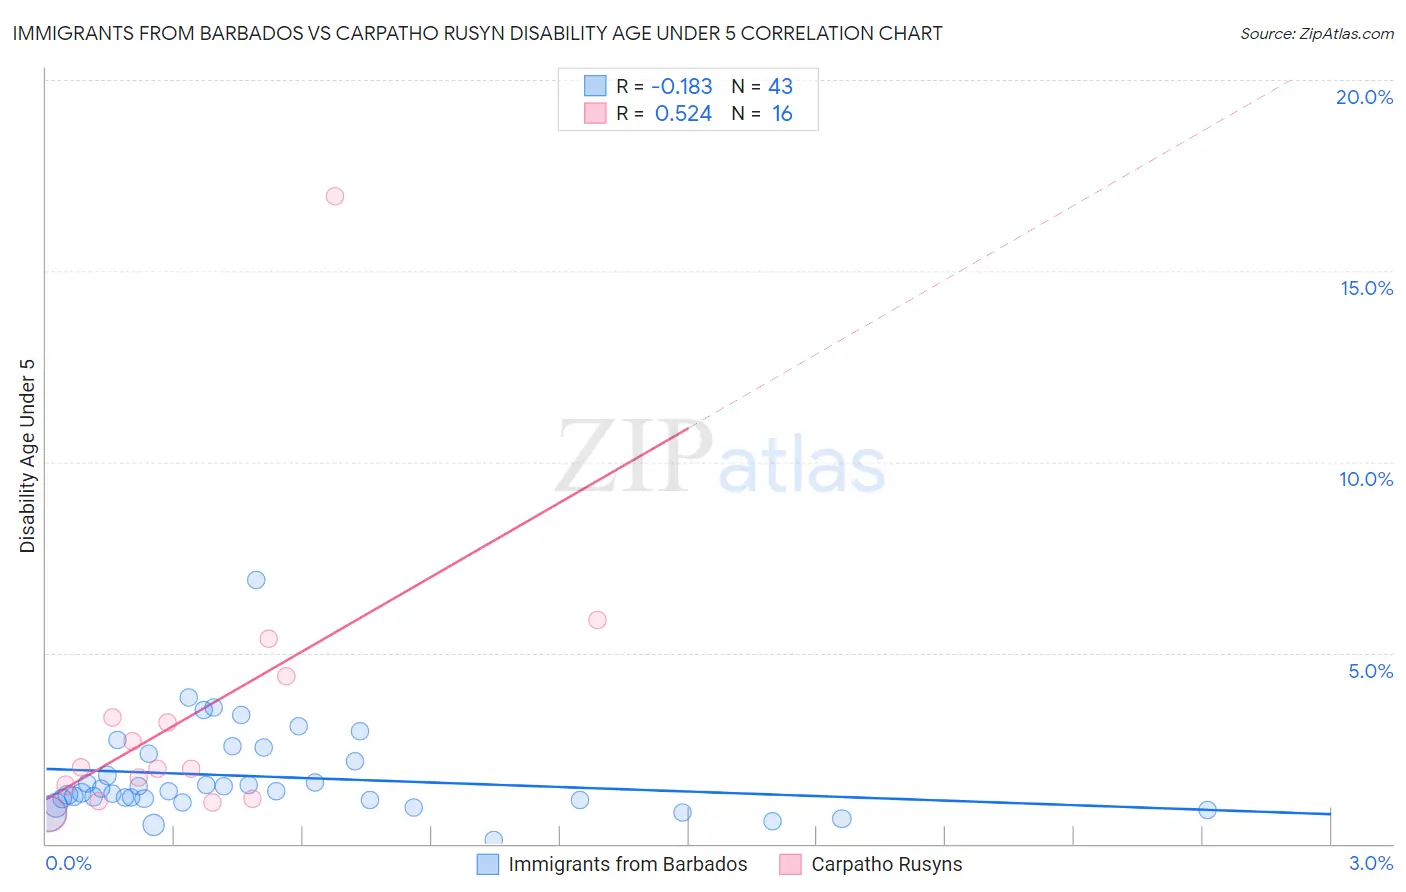
Immigrants from Barbados vs Carpatho Rusyn Disability Age Under 5 Correlation Chart

The statistical analysis conducted on geographies consisting of 80,516,356 people shows a poor negative correlation between the proportion of Immigrants from Barbados and percentage of population with a disability under the age of 5 in the United States with a correlation coefficient (R) of -0.183 and weighted average of 0.97%. Similarly, the statistical analysis conducted on geographies consisting of 46,602,246 people shows a substantial positive correlation between the proportion of Carpatho Rusyns and percentage of population with a disability under the age of 5 in the United States with a correlation coefficient (R) of 0.524 and weighted average of 1.4%, a difference of 46.9%.
Immigrants from Barbados vs Carpatho Rusyn Disability Age Under 5

Disability Age Under 5 Correlation Summary

MeasurementImmigrants from BarbadosCarpatho Rusyn
Minimum0.086%0.78%
Maximum6.9%16.9%
Range6.8%16.2%
Mean1.8%3.4%
Median1.4%2.0%
Interquartile 25% (IQ1)1.1%1.3%
Interquartile 75% (IQ3)2.4%3.8%
Interquartile Range (IQR)1.2%2.5%
Standard Deviation (Sample)1.2%3.9%
Standard Deviation (Population)1.2%3.8%

Similar Demographics by Disability Age Under 5

Demographics Similar to Immigrants from Barbados by Disability Age Under 5

In terms of disability age under 5, the demographic groups most similar to Immigrants from Barbados are Puget Sound Salish (0.97%, a difference of 0.37%), Nepalese (0.97%, a difference of 0.47%), Immigrants from China (0.96%, a difference of 0.58%), Immigrants from Israel (0.96%, a difference of 1.0%), and Immigrants from Hong Kong (0.95%, a difference of 2.3%).
DemographicsRating | RankDisability Age Under 5
Afghans
100.0
/100
|
#11
Exceptional
0.94%
Immigrants | Grenada
100.0
/100
|
#12
Exceptional
0.94%
Soviet Union
100.0
/100
|
#13
Exceptional
0.95%
Yuman
100.0
/100
|
#14
Exceptional
0.95%
Immigrants | Hong Kong
100.0
/100
|
#15
Exceptional
0.95%
Immigrants | Israel
100.0
/100
|
#16
Exceptional
0.96%
Immigrants | China
100.0
/100
|
#17
Exceptional
0.96%
Immigrants | Barbados
100.0
/100
|
#18
Exceptional
0.97%
Puget Sound Salish
100.0
/100
|
#19
Exceptional
0.97%
Nepalese
100.0
/100
|
#20
Exceptional
0.97%
British West Indians
100.0
/100
|
#21
Exceptional
0.99%
Immigrants | Iran
100.0
/100
|
#22
Exceptional
1.00%
Yakama
100.0
/100
|
#23
Exceptional
1.00%
Indians (Asian)
100.0
/100
|
#24
Exceptional
1.0%
Immigrants | Micronesia
100.0
/100
|
#25
Exceptional
1.0%

Demographics Similar to Carpatho Rusyns by Disability Age Under 5

In terms of disability age under 5, the demographic groups most similar to Carpatho Rusyns are Immigrants from Germany (1.4%, a difference of 0.030%), Yugoslavian (1.4%, a difference of 0.040%), Spanish (1.4%, a difference of 0.19%), Immigrants from Dominica (1.4%, a difference of 0.25%), and Immigrants from Netherlands (1.4%, a difference of 0.41%).
DemographicsRating | RankDisability Age Under 5
Costa Ricans
0.3
/100
|
#258
Tragic
1.4%
Immigrants | Southern Europe
0.3
/100
|
#259
Tragic
1.4%
Slavs
0.3
/100
|
#260
Tragic
1.4%
Immigrants | Netherlands
0.2
/100
|
#261
Tragic
1.4%
Immigrants | Dominica
0.2
/100
|
#262
Tragic
1.4%
Spanish
0.2
/100
|
#263
Tragic
1.4%
Yugoslavians
0.1
/100
|
#264
Tragic
1.4%
Carpatho Rusyns
0.1
/100
|
#265
Tragic
1.4%
Immigrants | Germany
0.1
/100
|
#266
Tragic
1.4%
Cree
0.1
/100
|
#267
Tragic
1.4%
Belgians
0.1
/100
|
#268
Tragic
1.4%
Austrians
0.1
/100
|
#269
Tragic
1.4%
Immigrants | North America
0.1
/100
|
#270
Tragic
1.4%
Immigrants | Canada
0.1
/100
|
#271
Tragic
1.4%
Blacks/African Americans
0.1
/100
|
#272
Tragic
1.4%