Immigrants from Eastern Africa vs Immigrants from Western Europe Vision Disability

COMPARE

Immigrants from Eastern Africa
Race
Ancestry
AfghanAfricanAlaska NativeAlaskan AthabascanAlbanianAleutAlsatianAmericanApacheArabArapahoArgentineanArmenianAssyrian/Chaldean/SyriacAustralianAustrianBahamianBangladeshiBarbadianBasqueBelgianBelizeanBermudanBhutaneseBlackfeetBolivianBrazilianBritishBritish West IndianBulgarianBurmeseCajunCambodianCanadianCape VerdeanCarpatho RusynCelticCentral AmericanCentral American IndianCherokeeCheyenneChickasawChileanChineseChippewaChoctawColombianColvilleComancheCosta RicanCreeCreekCroatianCrowCubanCypriotCzechCzechoslovakianDanishDelawareDominicanDutchDutch West IndianEastern EuropeanEcuadorianEgyptianEnglishEstonianEthiopianEuropeanFijianFilipinoFinnishFrenchFrench American IndianFrench CanadianGermanGerman RussianGhanaianGreekGuamanian/ChamorroGuatemalanGuyaneseHaitianHmongHonduranHopiHoumaHungarianIcelanderIndian (Asian)IndonesianInupiatIranianIraqiIrishIroquoisIsraeliItalianJamaicanJapaneseJordanianKenyanKiowaKoreanLaotianLatvianLebaneseLiberianLithuanianLumbeeLuxembourgerMacedonianMalaysianMalteseMarshalleseMenomineeMexicanMexican American IndianMongolianMoroccanNative HawaiianNavajoNepaleseNew ZealanderNicaraguanNigerianNorthern EuropeanNorwegianOkinawanOsageOttawaPaiutePakistaniPalestinianPanamanianParaguayanPennsylvania GermanPeruvianPimaPolishPortuguesePotawatomiPuebloPuerto RicanPuget Sound SalishRomanianRussianSalvadoranSamoanScandinavianScotch-IrishScottishSeminoleSenegaleseSerbianShoshoneSierra LeoneanSiouxSlavicSlovakSloveneSomaliSouth AfricanSouth AmericanSouth American IndianSoviet UnionSpaniardSpanishSpanish AmericanSpanish American IndianSri LankanSubsaharan AfricanSudaneseSwedishSwissSyrianTaiwaneseThaiTlingit-HaidaTohono O'OdhamTonganTrinidadian and TobagonianTsimshianTurkishU.S. Virgin IslanderUgandanUkrainianUruguayanUteVenezuelanVietnameseWelshWest IndianYakamaYaquiYugoslavianYumanYup'ikZimbabwean
Immigration
NonimmigrantsImmigrantsAfghanistanAfricaAlbaniaArgentinaArmeniaAsiaAustraliaAustriaBahamasBangladeshBarbadosBelarusBelgiumBelizeBoliviaBosnia and HerzegovinaBrazilBulgariaBurma/MyanmarCabo VerdeCambodiaCameroonCanadaCaribbeanCentral AmericaChileChinaColombiaCongoCosta RicaCroatiaCubaCzechoslovakiaDenmarkDominicaDominican RepublicEastern AfricaEastern AsiaEastern EuropeEcuadorEgyptEl SalvadorEnglandEritreaEthiopiaEuropeFijiFranceGermanyGhanaGreeceGrenadaGuatemalaGuyanaHaitiHondurasHong KongHungaryIndiaIndonesiaIranIraqIrelandIsraelItalyJamaicaJapanJordanKazakhstanKenyaKoreaKuwaitLaosLatin AmericaLatviaLebanonLiberiaLithuaniaMalaysiaMexicoMicronesiaMiddle AfricaMoldovaMoroccoNepalNetherlandsNicaraguaNigeriaNorth AmericaNorth MacedoniaNorthern AfricaNorthern EuropeNorwayOceaniaPakistanPanamaPeruPhilippinesPolandPortugalRomaniaRussiaSaudi ArabiaScotlandSenegalSerbiaSierra LeoneSingaporeSomaliaSouth AfricaSouth AmericaSouth Central AsiaSouth Eastern AsiaSouthern EuropeSpainSri LankaSt. Vincent and the GrenadinesSudanSwedenSwitzerlandSyriaTaiwanThailandTrinidad and TobagoTurkeyUgandaUkraineUruguayUzbekistanVenezuelaVietnamWest IndiesWestern AfricaWestern AsiaYemenZaireZimbabweAzores
Immigrants from Western Europe
Race
Ancestry
AfghanAfricanAlaska NativeAlaskan AthabascanAlbanianAleutAlsatianAmericanApacheArabArapahoArgentineanArmenianAssyrian/Chaldean/SyriacAustralianAustrianBahamianBangladeshiBarbadianBasqueBelgianBelizeanBermudanBhutaneseBlackfeetBolivianBrazilianBritishBritish West IndianBulgarianBurmeseCajunCambodianCanadianCape VerdeanCarpatho RusynCelticCentral AmericanCentral American IndianCherokeeCheyenneChickasawChileanChineseChippewaChoctawColombianColvilleComancheCosta RicanCreeCreekCroatianCrowCubanCypriotCzechCzechoslovakianDanishDelawareDominicanDutchDutch West IndianEastern EuropeanEcuadorianEgyptianEnglishEstonianEthiopianEuropeanFijianFilipinoFinnishFrenchFrench American IndianFrench CanadianGermanGerman RussianGhanaianGreekGuamanian/ChamorroGuatemalanGuyaneseHaitianHmongHonduranHopiHoumaHungarianIcelanderIndian (Asian)IndonesianInupiatIranianIraqiIrishIroquoisIsraeliItalianJamaicanJapaneseJordanianKenyanKiowaKoreanLaotianLatvianLebaneseLiberianLithuanianLumbeeLuxembourgerMacedonianMalaysianMalteseMarshalleseMenomineeMexicanMexican American IndianMongolianMoroccanNative HawaiianNavajoNepaleseNew ZealanderNicaraguanNigerianNorthern EuropeanNorwegianOkinawanOsageOttawaPaiutePakistaniPalestinianPanamanianParaguayanPennsylvania GermanPeruvianPimaPolishPortuguesePotawatomiPuebloPuerto RicanPuget Sound SalishRomanianRussianSalvadoranSamoanScandinavianScotch-IrishScottishSeminoleSenegaleseSerbianShoshoneSierra LeoneanSiouxSlavicSlovakSloveneSomaliSouth AfricanSouth AmericanSouth American IndianSoviet UnionSpaniardSpanishSpanish AmericanSpanish American IndianSri LankanSubsaharan AfricanSudaneseSwedishSwissSyrianTaiwaneseThaiTlingit-HaidaTohono O'OdhamTonganTrinidadian and TobagonianTsimshianTurkishU.S. Virgin IslanderUgandanUkrainianUruguayanUteVenezuelanVietnameseWelshWest IndianYakamaYaquiYugoslavianYumanYup'ikZimbabwean
Immigration
NonimmigrantsImmigrantsAfghanistanAfricaAlbaniaArgentinaArmeniaAsiaAustraliaAustriaBahamasBangladeshBarbadosBelarusBelgiumBelizeBoliviaBosnia and HerzegovinaBrazilBulgariaBurma/MyanmarCabo VerdeCambodiaCameroonCanadaCaribbeanCentral AmericaChileChinaColombiaCongoCosta RicaCroatiaCubaCzechoslovakiaDenmarkDominicaDominican RepublicEastern AsiaEastern EuropeEcuadorEgyptEl SalvadorEnglandEritreaEthiopiaEuropeFijiFranceGermanyGhanaGreeceGrenadaGuatemalaGuyanaHaitiHondurasHong KongHungaryIndiaIndonesiaIranIraqIrelandIsraelItalyJamaicaJapanJordanKazakhstanKenyaKoreaKuwaitLaosLatin AmericaLatviaLebanonLiberiaLithuaniaMalaysiaMexicoMicronesiaMiddle AfricaMoldovaMoroccoNepalNetherlandsNicaraguaNigeriaNorth AmericaNorth MacedoniaNorthern AfricaNorthern EuropeNorwayOceaniaPakistanPanamaPeruPhilippinesPolandPortugalRomaniaRussiaSaudi ArabiaScotlandSenegalSerbiaSierra LeoneSingaporeSomaliaSouth AfricaSouth AmericaSouth Central AsiaSouth Eastern AsiaSouthern EuropeSpainSri LankaSt. Vincent and the GrenadinesSudanSwedenSwitzerlandSyriaTaiwanThailandTrinidad and TobagoTurkeyUgandaUkraineUruguayUzbekistanVenezuelaVietnamWest IndiesWestern AfricaWestern AsiaWestern EuropeYemenZaireZimbabweAzores
Vision Disability
Income
Poverty
Unemployment
Labor Participation
Family Structure
Vehicle Availability
Education Level
Disability

Vision Disability Comparison

Immigrants from Eastern Africa

Immigrants from Western Europe

Exceptional
Average
2.0%
VISION DISABILITY
97.0/ 100
METRIC RATING
89th/ 347
METRIC RANK
2.2%
VISION DISABILITY
41.1/ 100
METRIC RATING
181st/ 347
METRIC RANK

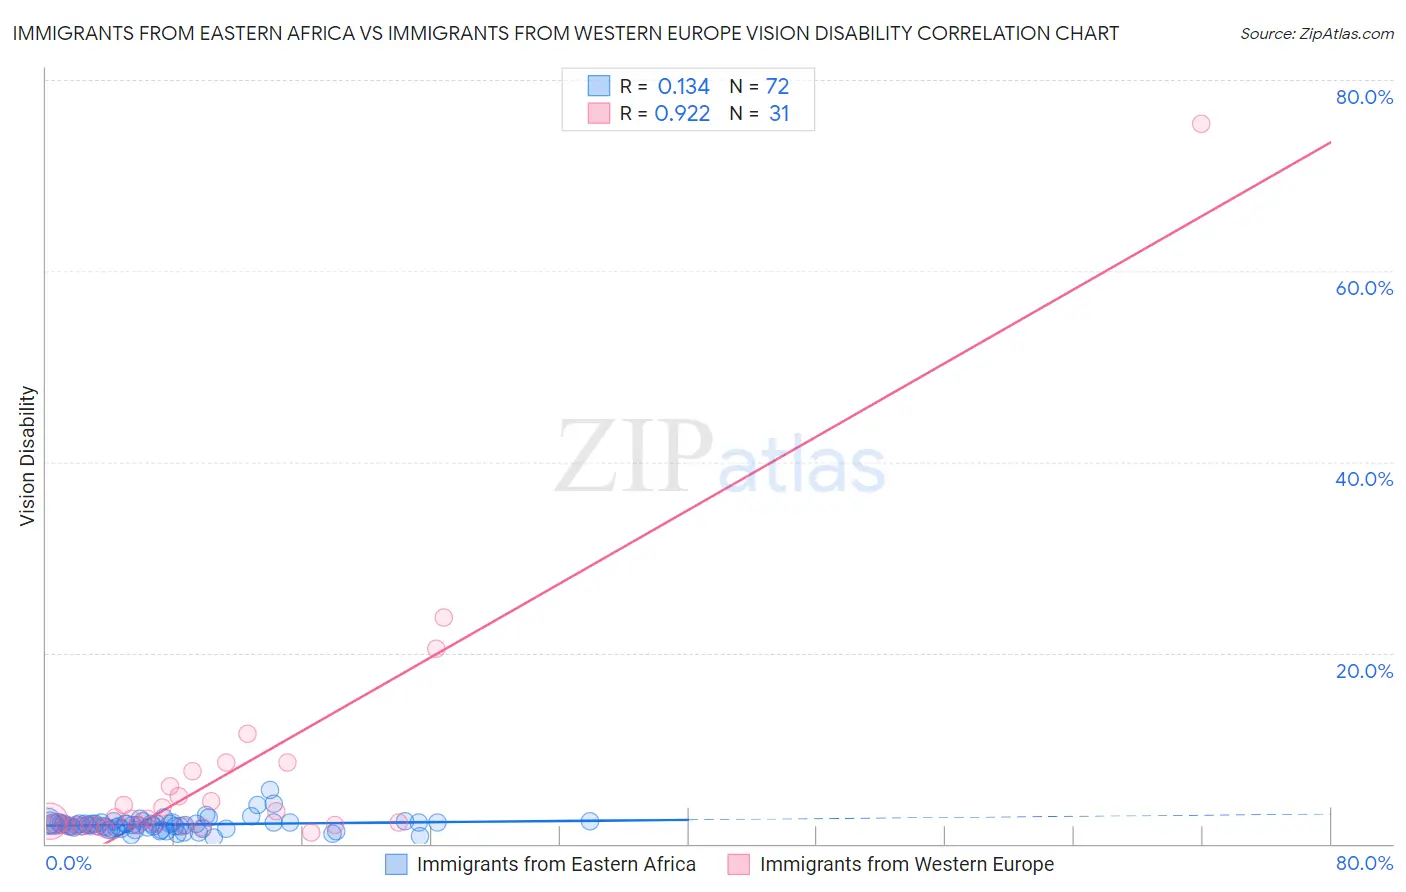
Immigrants from Eastern Africa vs Immigrants from Western Europe Vision Disability Correlation Chart

The statistical analysis conducted on geographies consisting of 354,920,232 people shows a poor positive correlation between the proportion of Immigrants from Eastern Africa and percentage of population with vision disability in the United States with a correlation coefficient (R) of 0.134 and weighted average of 2.0%. Similarly, the statistical analysis conducted on geographies consisting of 493,396,041 people shows a near-perfect positive correlation between the proportion of Immigrants from Western Europe and percentage of population with vision disability in the United States with a correlation coefficient (R) of 0.922 and weighted average of 2.2%, a difference of 6.4%.
Immigrants from Eastern Africa vs Immigrants from Western Europe Vision Disability

Vision Disability Correlation Summary

MeasurementImmigrants from Eastern AfricaImmigrants from Western Europe
Minimum0.61%1.2%
Maximum5.6%75.4%
Range5.0%74.2%
Mean2.0%7.0%
Median2.0%2.6%
Interquartile 25% (IQ1)1.7%1.9%
Interquartile 75% (IQ3)2.2%6.1%
Interquartile Range (IQR)0.55%4.2%
Standard Deviation (Sample)0.73%13.7%
Standard Deviation (Population)0.73%13.5%

Similar Demographics by Vision Disability

Demographics Similar to Immigrants from Eastern Africa by Vision Disability

In terms of vision disability, the demographic groups most similar to Immigrants from Eastern Africa are Norwegian (2.0%, a difference of 0.040%), Immigrants from Switzerland (2.0%, a difference of 0.050%), Immigrants from Moldova (2.0%, a difference of 0.11%), Chinese (2.0%, a difference of 0.14%), and Immigrants from Lebanon (2.1%, a difference of 0.14%).
DemographicsRating | RankVision Disability
Immigrants | Poland
97.6
/100
|
#82
Exceptional
2.0%
Immigrants | Western Asia
97.5
/100
|
#83
Exceptional
2.0%
Immigrants | Latvia
97.3
/100
|
#84
Exceptional
2.0%
Chinese
97.2
/100
|
#85
Exceptional
2.0%
Immigrants | Moldova
97.2
/100
|
#86
Exceptional
2.0%
Immigrants | Switzerland
97.0
/100
|
#87
Exceptional
2.0%
Norwegians
97.0
/100
|
#88
Exceptional
2.0%
Immigrants | Eastern Africa
97.0
/100
|
#89
Exceptional
2.0%
Immigrants | Lebanon
96.7
/100
|
#90
Exceptional
2.1%
Immigrants | Somalia
96.2
/100
|
#91
Exceptional
2.1%
Immigrants | Syria
96.2
/100
|
#92
Exceptional
2.1%
Immigrants | Europe
96.1
/100
|
#93
Exceptional
2.1%
Immigrants | Croatia
96.0
/100
|
#94
Exceptional
2.1%
Australians
95.9
/100
|
#95
Exceptional
2.1%
Romanians
95.7
/100
|
#96
Exceptional
2.1%

Demographics Similar to Immigrants from Western Europe by Vision Disability

In terms of vision disability, the demographic groups most similar to Immigrants from Western Europe are Costa Rican (2.2%, a difference of 0.020%), Uruguayan (2.2%, a difference of 0.10%), Immigrants from Burma/Myanmar (2.2%, a difference of 0.21%), Immigrants from North America (2.2%, a difference of 0.22%), and Immigrants from Oceania (2.2%, a difference of 0.26%).
DemographicsRating | RankVision Disability
Immigrants | Canada
50.0
/100
|
#174
Average
2.2%
Immigrants | Fiji
47.6
/100
|
#175
Average
2.2%
Yugoslavians
46.5
/100
|
#176
Average
2.2%
Slavs
46.0
/100
|
#177
Average
2.2%
Immigrants | Oceania
45.1
/100
|
#178
Average
2.2%
Immigrants | North America
44.5
/100
|
#179
Average
2.2%
Uruguayans
42.7
/100
|
#180
Average
2.2%
Immigrants | Western Europe
41.1
/100
|
#181
Average
2.2%
Costa Ricans
40.7
/100
|
#182
Average
2.2%
Immigrants | Burma/Myanmar
37.9
/100
|
#183
Fair
2.2%
Moroccans
35.4
/100
|
#184
Fair
2.2%
Immigrants | Middle Africa
33.5
/100
|
#185
Fair
2.2%
Native Hawaiians
33.3
/100
|
#186
Fair
2.2%
Immigrants | St. Vincent and the Grenadines
30.3
/100
|
#187
Fair
2.2%
Guyanese
28.9
/100
|
#188
Fair
2.2%