Yuman vs Immigrants from Asia Hearing Disability
COMPARE
Yuman
Immigrants from Asia
Hearing Disability
Hearing Disability Comparison
Yuman
Immigrants from Asia
3.4%
HEARING DISABILITY
0.4/ 100
METRIC RATING
250th/ 347
METRIC RANK
2.7%
HEARING DISABILITY
97.2/ 100
METRIC RATING
80th/ 347
METRIC RANK
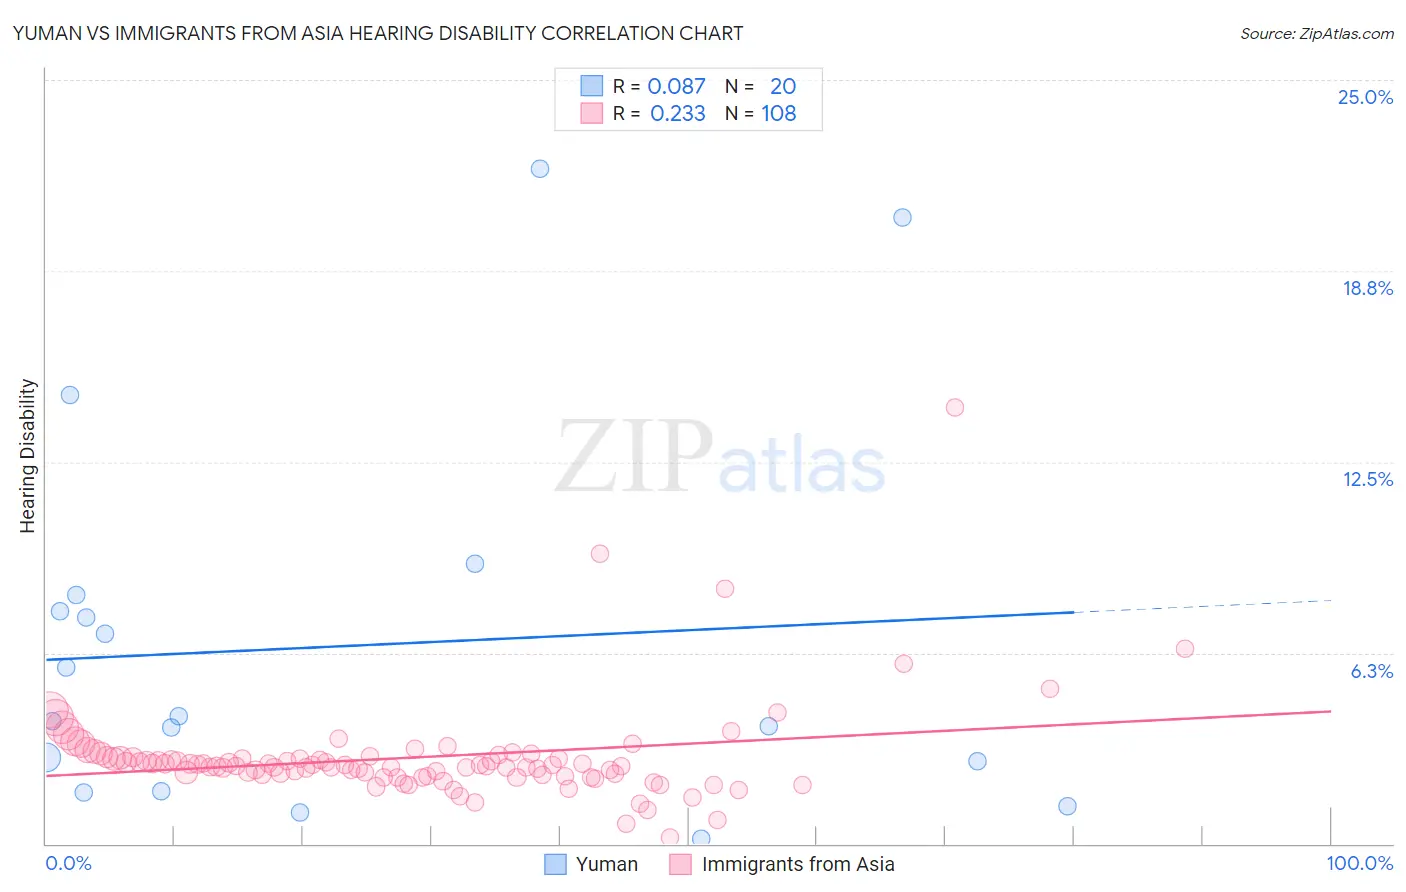
Yuman vs Immigrants from Asia Hearing Disability Correlation Chart
The statistical analysis conducted on geographies consisting of 40,662,882 people shows a slight positive correlation between the proportion of Yuman and percentage of population with hearing disability in the United States with a correlation coefficient (R) of 0.087 and weighted average of 3.4%. Similarly, the statistical analysis conducted on geographies consisting of 548,612,138 people shows a weak positive correlation between the proportion of Immigrants from Asia and percentage of population with hearing disability in the United States with a correlation coefficient (R) of 0.233 and weighted average of 2.7%, a difference of 23.0%.
Hearing Disability Correlation Summary
| Measurement | Yuman | Immigrants from Asia |
| Minimum | 0.16% | 0.21% |
| Maximum | 22.1% | 14.3% |
| Range | 22.0% | 14.1% |
| Mean | 6.5% | 2.8% |
| Median | 4.1% | 2.6% |
| Interquartile 25% (IQ1) | 2.2% | 2.2% |
| Interquartile 75% (IQ3) | 7.9% | 2.8% |
| Interquartile Range (IQR) | 5.7% | 0.58% |
| Standard Deviation (Sample) | 6.1% | 1.6% |
| Standard Deviation (Population) | 6.0% | 1.6% |
Similar Demographics by Hearing Disability
Demographics Similar to Yuman by Hearing Disability
In terms of hearing disability, the demographic groups most similar to Yuman are Italian (3.4%, a difference of 0.010%), Hungarian (3.4%, a difference of 0.23%), Croatian (3.4%, a difference of 0.44%), Austrian (3.4%, a difference of 0.54%), and Lithuanian (3.4%, a difference of 0.76%).
| Demographics | Rating | Rank | Hearing Disability |
| Immigrants | Western Europe | 1.0 /100 | #243 | Tragic 3.3% |
| Assyrians/Chaldeans/Syriacs | 0.9 /100 | #244 | Tragic 3.3% |
| Immigrants | Scotland | 0.8 /100 | #245 | Tragic 3.3% |
| Immigrants | England | 0.7 /100 | #246 | Tragic 3.3% |
| Lithuanians | 0.6 /100 | #247 | Tragic 3.4% |
| Austrians | 0.6 /100 | #248 | Tragic 3.4% |
| Italians | 0.4 /100 | #249 | Tragic 3.4% |
| Yuman | 0.4 /100 | #250 | Tragic 3.4% |
| Hungarians | 0.4 /100 | #251 | Tragic 3.4% |
| Croatians | 0.4 /100 | #252 | Tragic 3.4% |
| Carpatho Rusyns | 0.3 /100 | #253 | Tragic 3.4% |
| Slavs | 0.2 /100 | #254 | Tragic 3.4% |
| Poles | 0.2 /100 | #255 | Tragic 3.4% |
| Hmong | 0.2 /100 | #256 | Tragic 3.4% |
| Yaqui | 0.2 /100 | #257 | Tragic 3.4% |
Demographics Similar to Immigrants from Asia by Hearing Disability
In terms of hearing disability, the demographic groups most similar to Immigrants from Asia are Immigrants from Uruguay (2.7%, a difference of 0.030%), Immigrants from Armenia (2.7%, a difference of 0.050%), Immigrants from Cuba (2.7%, a difference of 0.060%), Colombian (2.7%, a difference of 0.18%), and Mongolian (2.7%, a difference of 0.20%).
| Demographics | Rating | Rank | Hearing Disability |
| Argentineans | 97.5 /100 | #73 | Exceptional 2.7% |
| Immigrants | Korea | 97.5 /100 | #74 | Exceptional 2.7% |
| Immigrants | Saudi Arabia | 97.5 /100 | #75 | Exceptional 2.7% |
| Asians | 97.5 /100 | #76 | Exceptional 2.7% |
| Immigrants | Malaysia | 97.5 /100 | #77 | Exceptional 2.7% |
| Mongolians | 97.4 /100 | #78 | Exceptional 2.7% |
| Colombians | 97.4 /100 | #79 | Exceptional 2.7% |
| Immigrants | Asia | 97.2 /100 | #80 | Exceptional 2.7% |
| Immigrants | Uruguay | 97.2 /100 | #81 | Exceptional 2.7% |
| Immigrants | Armenia | 97.2 /100 | #82 | Exceptional 2.7% |
| Immigrants | Cuba | 97.2 /100 | #83 | Exceptional 2.7% |
| Immigrants | Argentina | 97.0 /100 | #84 | Exceptional 2.8% |
| Immigrants | Northern Africa | 96.9 /100 | #85 | Exceptional 2.8% |
| Immigrants | Iran | 96.8 /100 | #86 | Exceptional 2.8% |
| Somalis | 96.7 /100 | #87 | Exceptional 2.8% |