Panamanian vs Austrian Vision Disability
COMPARE
Panamanian
Austrian
Vision Disability
Vision Disability Comparison
Panamanians
Austrians
2.3%
VISION DISABILITY
0.9/ 100
METRIC RATING
240th/ 347
METRIC RANK
2.1%
VISION DISABILITY
69.0/ 100
METRIC RATING
160th/ 347
METRIC RANK
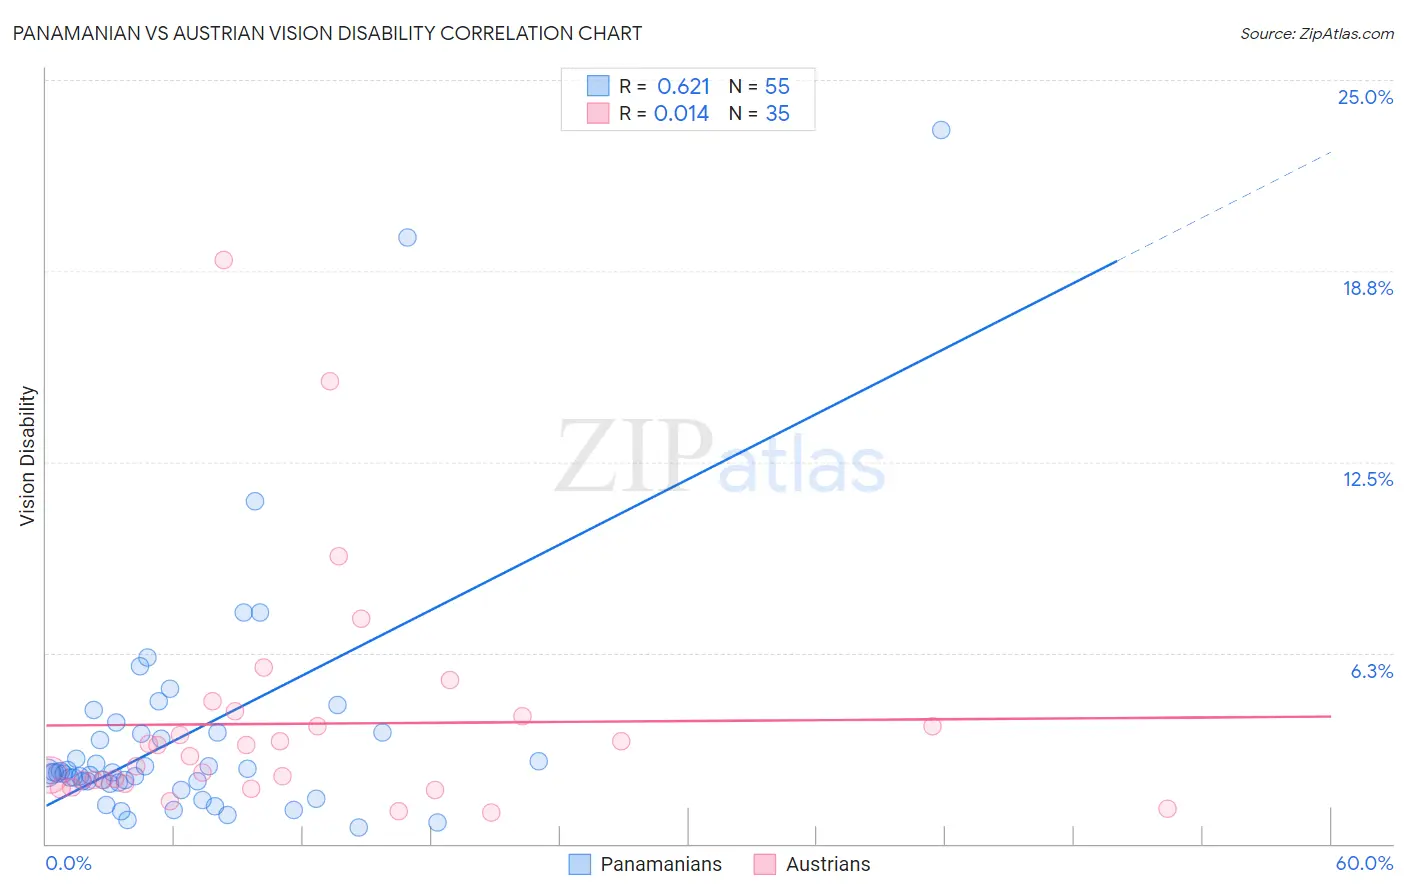
Panamanian vs Austrian Vision Disability Correlation Chart
The statistical analysis conducted on geographies consisting of 281,084,996 people shows a significant positive correlation between the proportion of Panamanians and percentage of population with vision disability in the United States with a correlation coefficient (R) of 0.621 and weighted average of 2.3%. Similarly, the statistical analysis conducted on geographies consisting of 451,572,198 people shows no correlation between the proportion of Austrians and percentage of population with vision disability in the United States with a correlation coefficient (R) of 0.014 and weighted average of 2.1%, a difference of 8.7%.
Vision Disability Correlation Summary
| Measurement | Panamanian | Austrian |
| Minimum | 0.54% | 1.0% |
| Maximum | 23.4% | 19.1% |
| Range | 22.8% | 18.1% |
| Mean | 3.5% | 3.9% |
| Median | 2.3% | 2.9% |
| Interquartile 25% (IQ1) | 2.0% | 2.0% |
| Interquartile 75% (IQ3) | 3.6% | 4.2% |
| Interquartile Range (IQR) | 1.6% | 2.2% |
| Standard Deviation (Sample) | 4.0% | 3.8% |
| Standard Deviation (Population) | 4.0% | 3.7% |
Similar Demographics by Vision Disability
Demographics Similar to Panamanians by Vision Disability
In terms of vision disability, the demographic groups most similar to Panamanians are Malaysian (2.3%, a difference of 0.030%), Immigrants from Panama (2.3%, a difference of 0.18%), English (2.3%, a difference of 0.25%), Immigrants from Cambodia (2.3%, a difference of 0.27%), and Immigrants from Portugal (2.3%, a difference of 0.54%).
| Demographics | Rating | Rank | Vision Disability |
| Central Americans | 1.8 /100 | #233 | Tragic 2.3% |
| Scottish | 1.6 /100 | #234 | Tragic 2.3% |
| Marshallese | 1.5 /100 | #235 | Tragic 2.3% |
| Immigrants | Congo | 1.4 /100 | #236 | Tragic 2.3% |
| Immigrants | Portugal | 1.4 /100 | #237 | Tragic 2.3% |
| Immigrants | Cambodia | 1.1 /100 | #238 | Tragic 2.3% |
| English | 1.1 /100 | #239 | Tragic 2.3% |
| Panamanians | 0.9 /100 | #240 | Tragic 2.3% |
| Malaysians | 0.9 /100 | #241 | Tragic 2.3% |
| Immigrants | Panama | 0.8 /100 | #242 | Tragic 2.3% |
| Immigrants | Nicaragua | 0.6 /100 | #243 | Tragic 2.3% |
| Immigrants | West Indies | 0.6 /100 | #244 | Tragic 2.3% |
| Alsatians | 0.6 /100 | #245 | Tragic 2.3% |
| French | 0.5 /100 | #246 | Tragic 2.3% |
| Guatemalans | 0.5 /100 | #247 | Tragic 2.3% |
Demographics Similar to Austrians by Vision Disability
In terms of vision disability, the demographic groups most similar to Austrians are South African (2.1%, a difference of 0.060%), Immigrants from Uzbekistan (2.1%, a difference of 0.070%), Serbian (2.1%, a difference of 0.090%), Iraqi (2.1%, a difference of 0.090%), and Hungarian (2.1%, a difference of 0.12%).
| Demographics | Rating | Rank | Vision Disability |
| Immigrants | South America | 73.8 /100 | #153 | Good 2.1% |
| Slovenes | 73.6 /100 | #154 | Good 2.1% |
| Immigrants | Colombia | 72.1 /100 | #155 | Good 2.1% |
| Pakistanis | 71.6 /100 | #156 | Good 2.1% |
| Serbians | 70.2 /100 | #157 | Good 2.1% |
| Immigrants | Uzbekistan | 69.9 /100 | #158 | Good 2.1% |
| South Africans | 69.8 /100 | #159 | Good 2.1% |
| Austrians | 69.0 /100 | #160 | Good 2.1% |
| Iraqis | 67.7 /100 | #161 | Good 2.1% |
| Hungarians | 67.4 /100 | #162 | Good 2.1% |
| Icelanders | 66.1 /100 | #163 | Good 2.1% |
| Immigrants | Bangladesh | 65.5 /100 | #164 | Good 2.1% |
| Immigrants | Iraq | 64.8 /100 | #165 | Good 2.1% |
| Immigrants | England | 62.8 /100 | #166 | Good 2.1% |
| Immigrants | Africa | 62.6 /100 | #167 | Good 2.1% |