Immigrants from Nigeria vs Immigrants from Barbados Male Disability
COMPARE
Immigrants from Nigeria
Immigrants from Barbados
Male Disability
Male Disability Comparison
Immigrants from Nigeria
Immigrants from Barbados
10.8%
MALE DISABILITY
95.1/ 100
METRIC RATING
104th/ 347
METRIC RANK
10.8%
MALE DISABILITY
92.2/ 100
METRIC RATING
115th/ 347
METRIC RANK
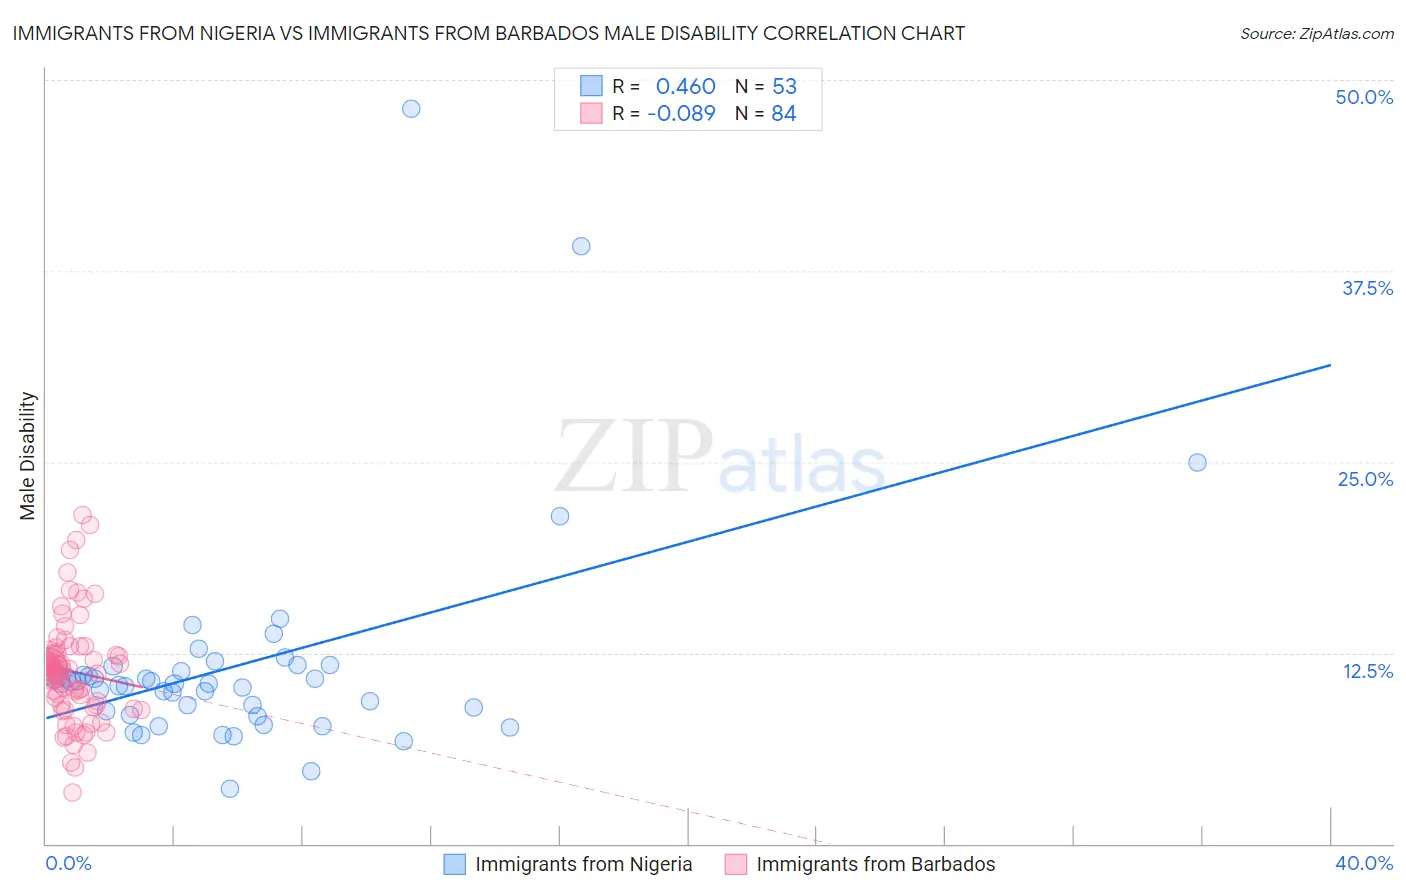
Immigrants from Nigeria vs Immigrants from Barbados Male Disability Correlation Chart
The statistical analysis conducted on geographies consisting of 283,467,451 people shows a moderate positive correlation between the proportion of Immigrants from Nigeria and percentage of males with a disability in the United States with a correlation coefficient (R) of 0.460 and weighted average of 10.8%. Similarly, the statistical analysis conducted on geographies consisting of 112,772,632 people shows a slight negative correlation between the proportion of Immigrants from Barbados and percentage of males with a disability in the United States with a correlation coefficient (R) of -0.089 and weighted average of 10.8%, a difference of 0.71%.
Male Disability Correlation Summary
| Measurement | Immigrants from Nigeria | Immigrants from Barbados |
| Minimum | 3.6% | 3.3% |
| Maximum | 48.1% | 21.5% |
| Range | 44.5% | 18.2% |
| Mean | 11.7% | 11.3% |
| Median | 10.5% | 11.4% |
| Interquartile 25% (IQ1) | 8.5% | 9.1% |
| Interquartile 75% (IQ3) | 11.6% | 12.5% |
| Interquartile Range (IQR) | 3.1% | 3.4% |
| Standard Deviation (Sample) | 7.3% | 3.4% |
| Standard Deviation (Population) | 7.2% | 3.4% |
Demographics Similar to Immigrants from Nigeria and Immigrants from Barbados by Male Disability
In terms of male disability, the demographic groups most similar to Immigrants from Nigeria are Immigrants from Brazil (10.8%, a difference of 0.010%), Uruguayan (10.7%, a difference of 0.060%), Immigrants from Syria (10.8%, a difference of 0.060%), Immigrants from Eastern Europe (10.7%, a difference of 0.080%), and Immigrants from Greece (10.7%, a difference of 0.17%). Similarly, the demographic groups most similar to Immigrants from Barbados are Immigrants from South Africa (10.8%, a difference of 0.080%), Central American (10.8%, a difference of 0.10%), Immigrants from Zimbabwe (10.8%, a difference of 0.16%), Ghanaian (10.8%, a difference of 0.25%), and Eastern European (10.9%, a difference of 0.29%).
| Demographics | Rating | Rank | Male Disability |
| Immigrants | Switzerland | 96.1 /100 | #99 | Exceptional 10.7% |
| Immigrants | Kazakhstan | 95.9 /100 | #100 | Exceptional 10.7% |
| Immigrants | Greece | 95.6 /100 | #101 | Exceptional 10.7% |
| Immigrants | Eastern Europe | 95.3 /100 | #102 | Exceptional 10.7% |
| Uruguayans | 95.3 /100 | #103 | Exceptional 10.7% |
| Immigrants | Nigeria | 95.1 /100 | #104 | Exceptional 10.8% |
| Immigrants | Brazil | 95.0 /100 | #105 | Exceptional 10.8% |
| Immigrants | Syria | 94.9 /100 | #106 | Exceptional 10.8% |
| Immigrants | Eastern Africa | 94.3 /100 | #107 | Exceptional 10.8% |
| Immigrants | Belgium | 94.2 /100 | #108 | Exceptional 10.8% |
| Immigrants | Uganda | 94.0 /100 | #109 | Exceptional 10.8% |
| Immigrants | Immigrants | 93.9 /100 | #110 | Exceptional 10.8% |
| Immigrants | Uruguay | 93.8 /100 | #111 | Exceptional 10.8% |
| Ghanaians | 93.4 /100 | #112 | Exceptional 10.8% |
| Immigrants | Zimbabwe | 93.0 /100 | #113 | Exceptional 10.8% |
| Central Americans | 92.7 /100 | #114 | Exceptional 10.8% |
| Immigrants | Barbados | 92.2 /100 | #115 | Exceptional 10.8% |
| Immigrants | South Africa | 91.8 /100 | #116 | Exceptional 10.8% |
| Eastern Europeans | 90.6 /100 | #117 | Exceptional 10.9% |
| Immigrants | Cuba | 90.2 /100 | #118 | Exceptional 10.9% |
| Armenians | 90.1 /100 | #119 | Exceptional 10.9% |