Brazilian vs South American Cognitive Disability
COMPARE
Brazilian
South American
Cognitive Disability
Cognitive Disability Comparison
Brazilians
South Americans
17.1%
COGNITIVE DISABILITY
78.9/ 100
METRIC RATING
155th/ 347
METRIC RANK
16.7%
COGNITIVE DISABILITY
98.8/ 100
METRIC RATING
90th/ 347
METRIC RANK
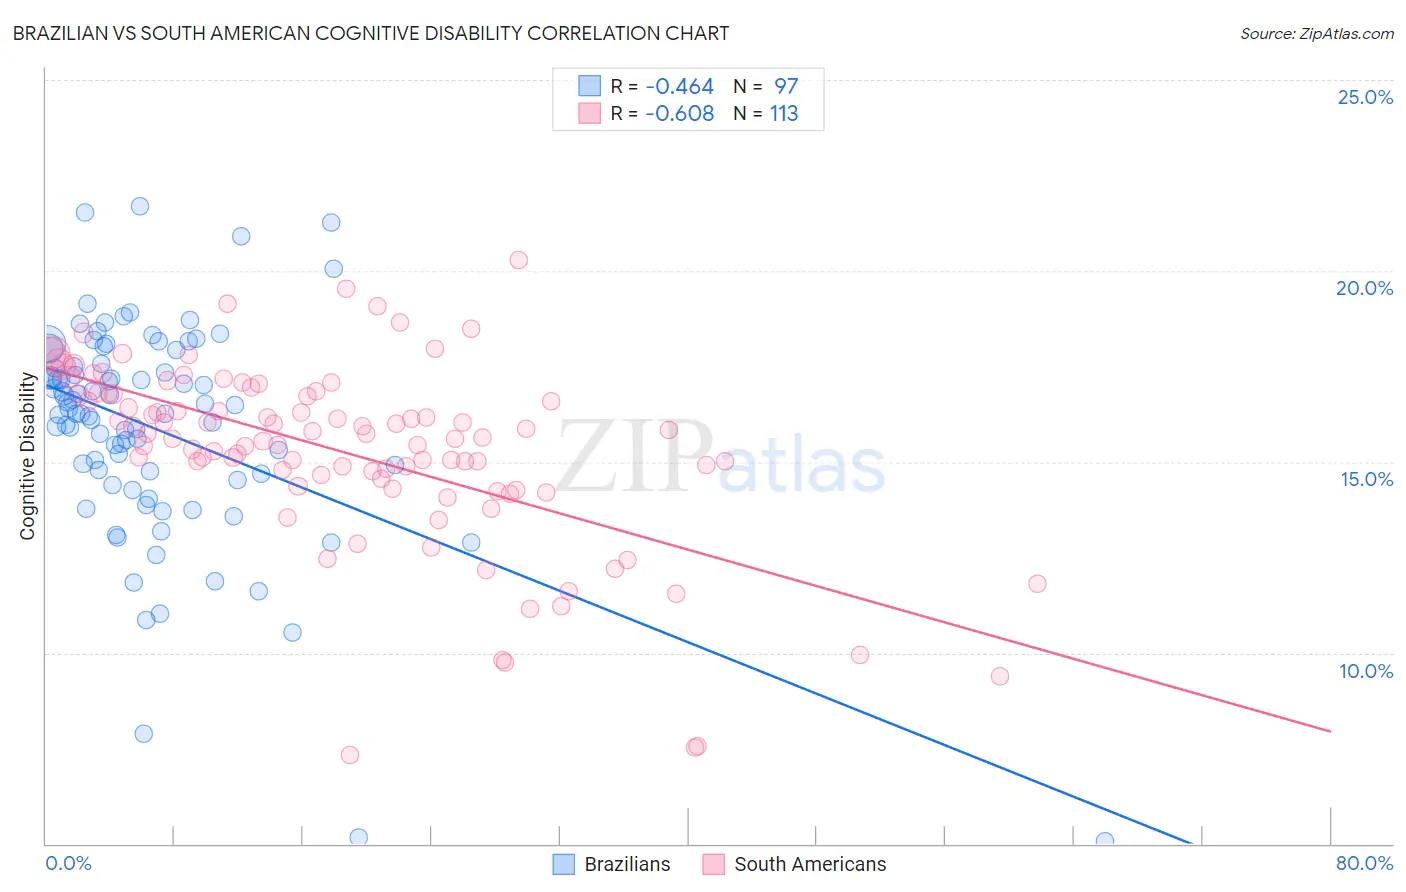
Brazilian vs South American Cognitive Disability Correlation Chart
The statistical analysis conducted on geographies consisting of 323,952,153 people shows a moderate negative correlation between the proportion of Brazilians and percentage of population with cognitive disability in the United States with a correlation coefficient (R) of -0.464 and weighted average of 17.1%. Similarly, the statistical analysis conducted on geographies consisting of 494,074,477 people shows a significant negative correlation between the proportion of South Americans and percentage of population with cognitive disability in the United States with a correlation coefficient (R) of -0.608 and weighted average of 16.7%, a difference of 2.3%.
Cognitive Disability Correlation Summary
| Measurement | Brazilian | South American |
| Minimum | 5.1% | 7.3% |
| Maximum | 21.7% | 20.3% |
| Range | 16.6% | 12.9% |
| Mean | 15.9% | 15.2% |
| Median | 16.3% | 15.6% |
| Interquartile 25% (IQ1) | 14.6% | 14.5% |
| Interquartile 75% (IQ3) | 17.5% | 16.8% |
| Interquartile Range (IQR) | 2.9% | 2.3% |
| Standard Deviation (Sample) | 2.9% | 2.4% |
| Standard Deviation (Population) | 2.9% | 2.4% |
Similar Demographics by Cognitive Disability
Demographics Similar to Brazilians by Cognitive Disability
In terms of cognitive disability, the demographic groups most similar to Brazilians are Sri Lankan (17.1%, a difference of 0.0%), Immigrants from Malaysia (17.1%, a difference of 0.020%), Immigrants from Kazakhstan (17.1%, a difference of 0.070%), Immigrants from Australia (17.1%, a difference of 0.12%), and Immigrants from Indonesia (17.1%, a difference of 0.17%).
| Demographics | Rating | Rank | Cognitive Disability |
| French Canadians | 85.7 /100 | #148 | Excellent 17.1% |
| Cypriots | 85.7 /100 | #149 | Excellent 17.1% |
| Basques | 85.5 /100 | #150 | Excellent 17.1% |
| Syrians | 83.0 /100 | #151 | Excellent 17.1% |
| Immigrants | Indonesia | 82.7 /100 | #152 | Excellent 17.1% |
| Immigrants | Kazakhstan | 80.5 /100 | #153 | Excellent 17.1% |
| Immigrants | Malaysia | 79.3 /100 | #154 | Good 17.1% |
| Brazilians | 78.9 /100 | #155 | Good 17.1% |
| Sri Lankans | 78.9 /100 | #156 | Good 17.1% |
| Immigrants | Australia | 76.0 /100 | #157 | Good 17.1% |
| Celtics | 74.1 /100 | #158 | Good 17.1% |
| Immigrants | Latvia | 73.2 /100 | #159 | Good 17.2% |
| Australians | 72.4 /100 | #160 | Good 17.2% |
| Americans | 72.2 /100 | #161 | Good 17.2% |
| Yugoslavians | 71.6 /100 | #162 | Good 17.2% |
Demographics Similar to South Americans by Cognitive Disability
In terms of cognitive disability, the demographic groups most similar to South Americans are Immigrants from Egypt (16.7%, a difference of 0.0%), Danish (16.7%, a difference of 0.010%), Immigrants from South America (16.7%, a difference of 0.020%), Immigrants from Southern Europe (16.7%, a difference of 0.020%), and Asian (16.7%, a difference of 0.070%).
| Demographics | Rating | Rank | Cognitive Disability |
| Serbians | 99.1 /100 | #83 | Exceptional 16.7% |
| Belgians | 99.1 /100 | #84 | Exceptional 16.7% |
| Immigrants | Moldova | 99.1 /100 | #85 | Exceptional 16.7% |
| Immigrants | South Africa | 99.0 /100 | #86 | Exceptional 16.7% |
| Native Hawaiians | 99.0 /100 | #87 | Exceptional 16.7% |
| Immigrants | Philippines | 99.0 /100 | #88 | Exceptional 16.7% |
| Immigrants | Egypt | 98.8 /100 | #89 | Exceptional 16.7% |
| South Americans | 98.8 /100 | #90 | Exceptional 16.7% |
| Danes | 98.8 /100 | #91 | Exceptional 16.7% |
| Immigrants | South America | 98.8 /100 | #92 | Exceptional 16.7% |
| Immigrants | Southern Europe | 98.7 /100 | #93 | Exceptional 16.7% |
| Asians | 98.7 /100 | #94 | Exceptional 16.7% |
| English | 98.6 /100 | #95 | Exceptional 16.8% |
| Finns | 98.5 /100 | #96 | Exceptional 16.8% |
| Dutch | 98.5 /100 | #97 | Exceptional 16.8% |