Bolivian vs Immigrants from Switzerland Cognitive Disability
COMPARE
Bolivian
Immigrants from Switzerland
Cognitive Disability
Cognitive Disability Comparison
Bolivians
Immigrants from Switzerland
16.5%
COGNITIVE DISABILITY
99.9/ 100
METRIC RATING
39th/ 347
METRIC RANK
17.2%
COGNITIVE DISABILITY
71.5/ 100
METRIC RATING
163rd/ 347
METRIC RANK
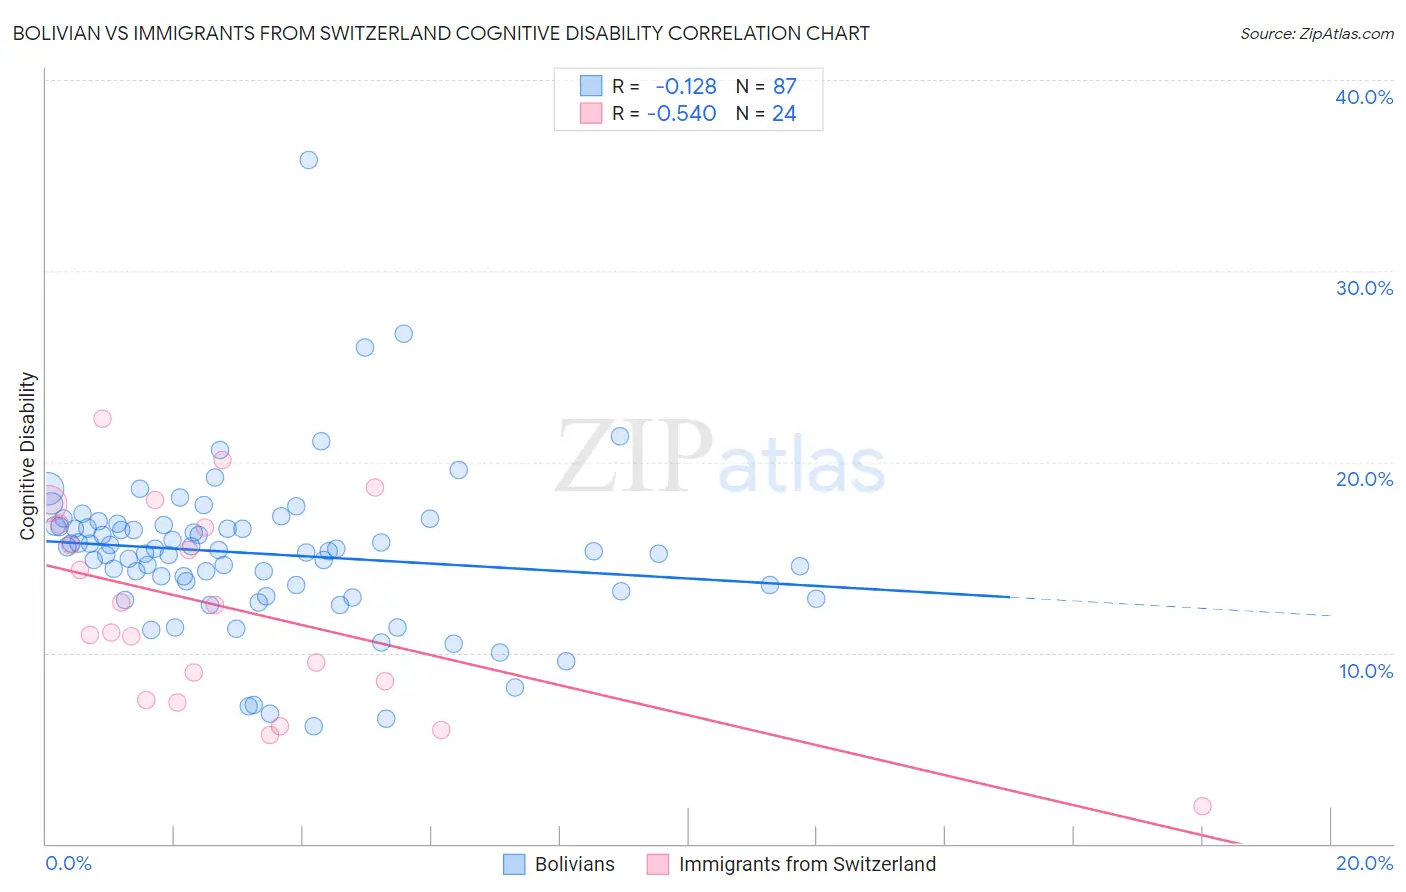
Bolivian vs Immigrants from Switzerland Cognitive Disability Correlation Chart
The statistical analysis conducted on geographies consisting of 184,677,815 people shows a poor negative correlation between the proportion of Bolivians and percentage of population with cognitive disability in the United States with a correlation coefficient (R) of -0.128 and weighted average of 16.5%. Similarly, the statistical analysis conducted on geographies consisting of 148,077,792 people shows a substantial negative correlation between the proportion of Immigrants from Switzerland and percentage of population with cognitive disability in the United States with a correlation coefficient (R) of -0.540 and weighted average of 17.2%, a difference of 4.2%.
Cognitive Disability Correlation Summary
| Measurement | Bolivian | Immigrants from Switzerland |
| Minimum | 6.2% | 2.0% |
| Maximum | 35.8% | 22.2% |
| Range | 29.7% | 20.3% |
| Mean | 15.2% | 12.3% |
| Median | 15.3% | 11.8% |
| Interquartile 25% (IQ1) | 13.3% | 8.0% |
| Interquartile 75% (IQ3) | 16.6% | 16.7% |
| Interquartile Range (IQR) | 3.4% | 8.6% |
| Standard Deviation (Sample) | 4.2% | 5.3% |
| Standard Deviation (Population) | 4.2% | 5.2% |
Similar Demographics by Cognitive Disability
Demographics Similar to Bolivians by Cognitive Disability
In terms of cognitive disability, the demographic groups most similar to Bolivians are Immigrants from Belarus (16.5%, a difference of 0.010%), Cuban (16.5%, a difference of 0.020%), Hungarian (16.5%, a difference of 0.030%), Immigrants from Eastern Europe (16.5%, a difference of 0.070%), and Slovene (16.5%, a difference of 0.090%).
| Demographics | Rating | Rank | Cognitive Disability |
| Immigrants | Israel | 99.9 /100 | #32 | Exceptional 16.4% |
| Italians | 99.9 /100 | #33 | Exceptional 16.4% |
| Russians | 99.9 /100 | #34 | Exceptional 16.4% |
| Slovaks | 99.9 /100 | #35 | Exceptional 16.4% |
| Greeks | 99.9 /100 | #36 | Exceptional 16.4% |
| Slovenes | 99.9 /100 | #37 | Exceptional 16.5% |
| Immigrants | Eastern Europe | 99.9 /100 | #38 | Exceptional 16.5% |
| Bolivians | 99.9 /100 | #39 | Exceptional 16.5% |
| Immigrants | Belarus | 99.9 /100 | #40 | Exceptional 16.5% |
| Cubans | 99.9 /100 | #41 | Exceptional 16.5% |
| Hungarians | 99.9 /100 | #42 | Exceptional 16.5% |
| Immigrants | Canada | 99.8 /100 | #43 | Exceptional 16.5% |
| Macedonians | 99.8 /100 | #44 | Exceptional 16.5% |
| Immigrants | Europe | 99.8 /100 | #45 | Exceptional 16.5% |
| Immigrants | Colombia | 99.8 /100 | #46 | Exceptional 16.5% |
Demographics Similar to Immigrants from Switzerland by Cognitive Disability
In terms of cognitive disability, the demographic groups most similar to Immigrants from Switzerland are Yugoslavian (17.2%, a difference of 0.0%), American (17.2%, a difference of 0.020%), Australian (17.2%, a difference of 0.030%), Armenian (17.2%, a difference of 0.050%), and Immigrants from Latvia (17.2%, a difference of 0.060%).
| Demographics | Rating | Rank | Cognitive Disability |
| Sri Lankans | 78.9 /100 | #156 | Good 17.1% |
| Immigrants | Australia | 76.0 /100 | #157 | Good 17.1% |
| Celtics | 74.1 /100 | #158 | Good 17.1% |
| Immigrants | Latvia | 73.2 /100 | #159 | Good 17.2% |
| Australians | 72.4 /100 | #160 | Good 17.2% |
| Americans | 72.2 /100 | #161 | Good 17.2% |
| Yugoslavians | 71.6 /100 | #162 | Good 17.2% |
| Immigrants | Switzerland | 71.5 /100 | #163 | Good 17.2% |
| Armenians | 70.1 /100 | #164 | Good 17.2% |
| Immigrants | Albania | 64.9 /100 | #165 | Good 17.2% |
| Immigrants | Ecuador | 64.4 /100 | #166 | Good 17.2% |
| Immigrants | Syria | 63.5 /100 | #167 | Good 17.2% |
| Immigrants | Immigrants | 62.5 /100 | #168 | Good 17.2% |
| Immigrants | Portugal | 61.8 /100 | #169 | Good 17.2% |
| Ecuadorians | 59.6 /100 | #170 | Average 17.2% |