Bolivian vs Immigrants from Kazakhstan Cognitive Disability
COMPARE
Bolivian
Immigrants from Kazakhstan
Cognitive Disability
Cognitive Disability Comparison
Bolivians
Immigrants from Kazakhstan
16.5%
COGNITIVE DISABILITY
99.9/ 100
METRIC RATING
39th/ 347
METRIC RANK
17.1%
COGNITIVE DISABILITY
80.5/ 100
METRIC RATING
153rd/ 347
METRIC RANK
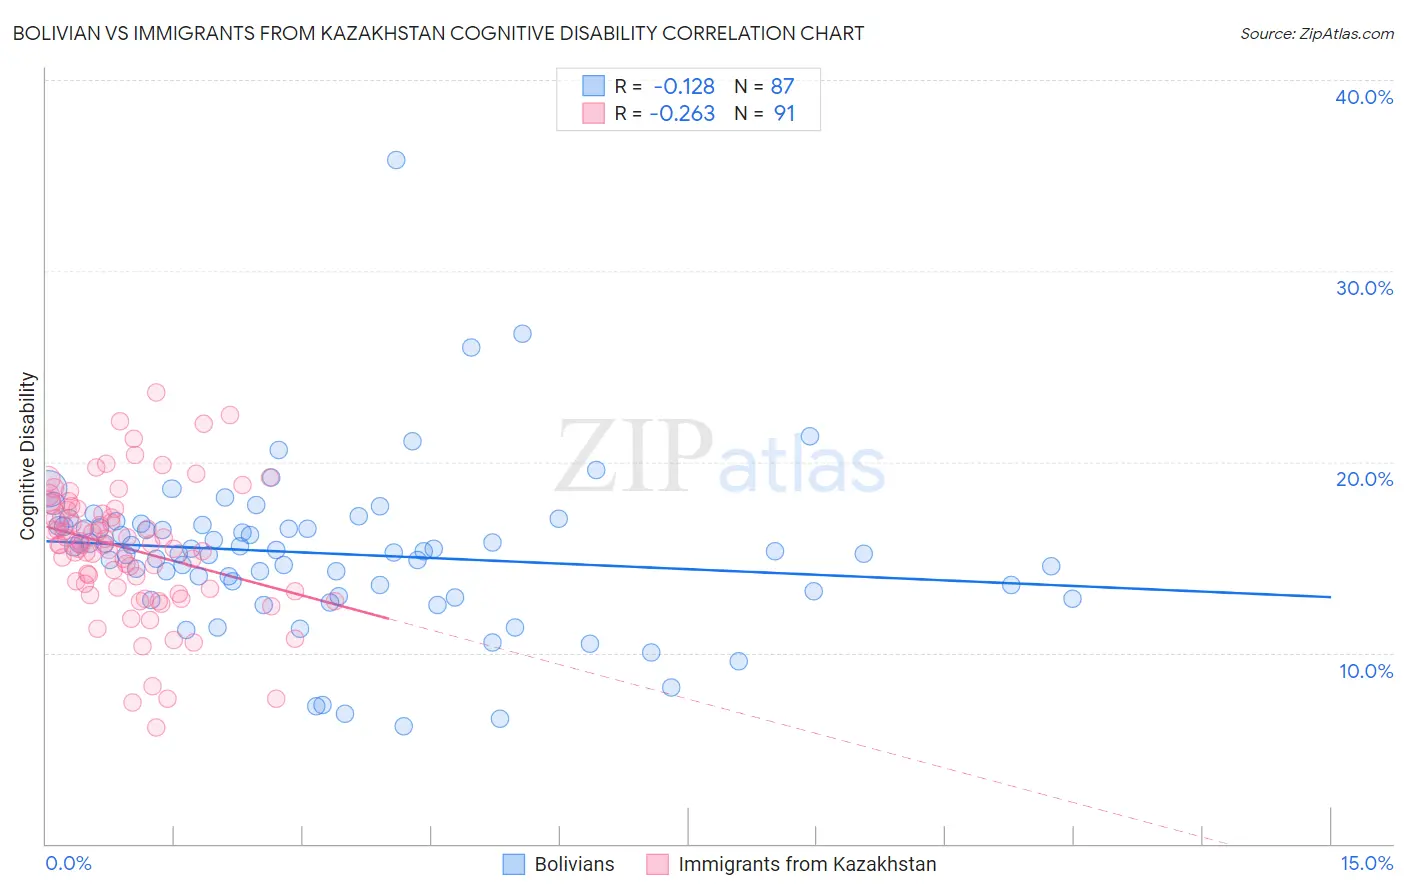
Bolivian vs Immigrants from Kazakhstan Cognitive Disability Correlation Chart
The statistical analysis conducted on geographies consisting of 184,677,815 people shows a poor negative correlation between the proportion of Bolivians and percentage of population with cognitive disability in the United States with a correlation coefficient (R) of -0.128 and weighted average of 16.5%. Similarly, the statistical analysis conducted on geographies consisting of 124,443,744 people shows a weak negative correlation between the proportion of Immigrants from Kazakhstan and percentage of population with cognitive disability in the United States with a correlation coefficient (R) of -0.263 and weighted average of 17.1%, a difference of 3.9%.
Cognitive Disability Correlation Summary
| Measurement | Bolivian | Immigrants from Kazakhstan |
| Minimum | 6.2% | 6.1% |
| Maximum | 35.8% | 23.7% |
| Range | 29.7% | 17.6% |
| Mean | 15.2% | 15.5% |
| Median | 15.3% | 15.7% |
| Interquartile 25% (IQ1) | 13.3% | 13.4% |
| Interquartile 75% (IQ3) | 16.6% | 17.5% |
| Interquartile Range (IQR) | 3.4% | 4.2% |
| Standard Deviation (Sample) | 4.2% | 3.4% |
| Standard Deviation (Population) | 4.2% | 3.4% |
Similar Demographics by Cognitive Disability
Demographics Similar to Bolivians by Cognitive Disability
In terms of cognitive disability, the demographic groups most similar to Bolivians are Immigrants from Belarus (16.5%, a difference of 0.010%), Cuban (16.5%, a difference of 0.020%), Hungarian (16.5%, a difference of 0.030%), Immigrants from Eastern Europe (16.5%, a difference of 0.070%), and Slovene (16.5%, a difference of 0.090%).
| Demographics | Rating | Rank | Cognitive Disability |
| Immigrants | Israel | 99.9 /100 | #32 | Exceptional 16.4% |
| Italians | 99.9 /100 | #33 | Exceptional 16.4% |
| Russians | 99.9 /100 | #34 | Exceptional 16.4% |
| Slovaks | 99.9 /100 | #35 | Exceptional 16.4% |
| Greeks | 99.9 /100 | #36 | Exceptional 16.4% |
| Slovenes | 99.9 /100 | #37 | Exceptional 16.5% |
| Immigrants | Eastern Europe | 99.9 /100 | #38 | Exceptional 16.5% |
| Bolivians | 99.9 /100 | #39 | Exceptional 16.5% |
| Immigrants | Belarus | 99.9 /100 | #40 | Exceptional 16.5% |
| Cubans | 99.9 /100 | #41 | Exceptional 16.5% |
| Hungarians | 99.9 /100 | #42 | Exceptional 16.5% |
| Immigrants | Canada | 99.8 /100 | #43 | Exceptional 16.5% |
| Macedonians | 99.8 /100 | #44 | Exceptional 16.5% |
| Immigrants | Europe | 99.8 /100 | #45 | Exceptional 16.5% |
| Immigrants | Colombia | 99.8 /100 | #46 | Exceptional 16.5% |
Demographics Similar to Immigrants from Kazakhstan by Cognitive Disability
In terms of cognitive disability, the demographic groups most similar to Immigrants from Kazakhstan are Immigrants from Malaysia (17.1%, a difference of 0.050%), Brazilian (17.1%, a difference of 0.070%), Sri Lankan (17.1%, a difference of 0.070%), Immigrants from Indonesia (17.1%, a difference of 0.10%), and Syrian (17.1%, a difference of 0.12%).
| Demographics | Rating | Rank | Cognitive Disability |
| Costa Ricans | 88.0 /100 | #146 | Excellent 17.0% |
| Scotch-Irish | 85.9 /100 | #147 | Excellent 17.1% |
| French Canadians | 85.7 /100 | #148 | Excellent 17.1% |
| Cypriots | 85.7 /100 | #149 | Excellent 17.1% |
| Basques | 85.5 /100 | #150 | Excellent 17.1% |
| Syrians | 83.0 /100 | #151 | Excellent 17.1% |
| Immigrants | Indonesia | 82.7 /100 | #152 | Excellent 17.1% |
| Immigrants | Kazakhstan | 80.5 /100 | #153 | Excellent 17.1% |
| Immigrants | Malaysia | 79.3 /100 | #154 | Good 17.1% |
| Brazilians | 78.9 /100 | #155 | Good 17.1% |
| Sri Lankans | 78.9 /100 | #156 | Good 17.1% |
| Immigrants | Australia | 76.0 /100 | #157 | Good 17.1% |
| Celtics | 74.1 /100 | #158 | Good 17.1% |
| Immigrants | Latvia | 73.2 /100 | #159 | Good 17.2% |
| Australians | 72.4 /100 | #160 | Good 17.2% |