Immigrants from Central America vs Native/Alaskan Disability Age 18 to 34
COMPARE
Immigrants from Central America
Native/Alaskan
Disability Age 18 to 34
Disability Age 18 to 34 Comparison
Immigrants from Central America
Natives/Alaskans
6.5%
DISABILITY AGE 18 TO 34
76.8/ 100
METRIC RATING
154th/ 347
METRIC RANK
8.2%
DISABILITY AGE 18 TO 34
0.0/ 100
METRIC RATING
325th/ 347
METRIC RANK
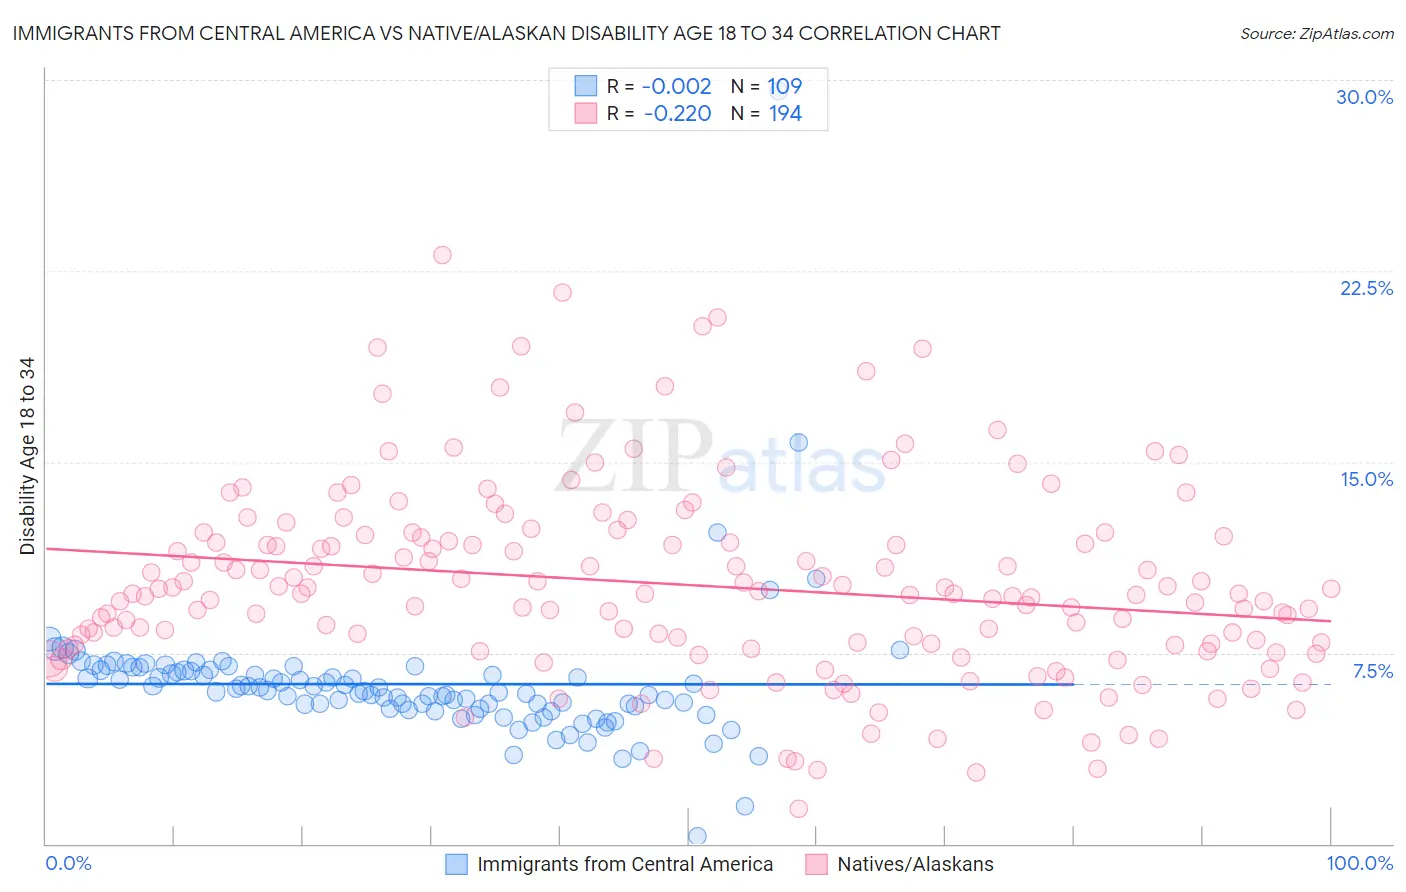
Immigrants from Central America vs Native/Alaskan Disability Age 18 to 34 Correlation Chart
The statistical analysis conducted on geographies consisting of 533,089,991 people shows no correlation between the proportion of Immigrants from Central America and percentage of population with a disability between the ages 18 and 35 in the United States with a correlation coefficient (R) of -0.002 and weighted average of 6.5%. Similarly, the statistical analysis conducted on geographies consisting of 510,415,530 people shows a weak negative correlation between the proportion of Natives/Alaskans and percentage of population with a disability between the ages 18 and 35 in the United States with a correlation coefficient (R) of -0.220 and weighted average of 8.2%, a difference of 27.1%.
Disability Age 18 to 34 Correlation Summary
| Measurement | Immigrants from Central America | Native/Alaskan |
| Minimum | 0.28% | 1.4% |
| Maximum | 29.6% | 23.1% |
| Range | 29.3% | 21.8% |
| Mean | 6.3% | 10.2% |
| Median | 6.0% | 9.8% |
| Interquartile 25% (IQ1) | 5.3% | 7.8% |
| Interquartile 75% (IQ3) | 6.8% | 12.1% |
| Interquartile Range (IQR) | 1.5% | 4.2% |
| Standard Deviation (Sample) | 2.8% | 3.8% |
| Standard Deviation (Population) | 2.8% | 3.8% |
Similar Demographics by Disability Age 18 to 34
Demographics Similar to Immigrants from Central America by Disability Age 18 to 34
In terms of disability age 18 to 34, the demographic groups most similar to Immigrants from Central America are Inupiat (6.5%, a difference of 0.0%), Immigrants from Eritrea (6.5%, a difference of 0.060%), Immigrants from Panama (6.5%, a difference of 0.14%), Bulgarian (6.5%, a difference of 0.16%), and Immigrants from Sierra Leone (6.5%, a difference of 0.17%).
| Demographics | Rating | Rank | Disability Age 18 to 34 |
| Immigrants | South Africa | 83.7 /100 | #147 | Excellent 6.4% |
| Immigrants | Belgium | 83.5 /100 | #148 | Excellent 6.4% |
| Hondurans | 83.1 /100 | #149 | Excellent 6.4% |
| Immigrants | Dominican Republic | 82.7 /100 | #150 | Excellent 6.4% |
| Tongans | 81.9 /100 | #151 | Excellent 6.4% |
| Bulgarians | 78.3 /100 | #152 | Good 6.5% |
| Immigrants | Eritrea | 77.4 /100 | #153 | Good 6.5% |
| Immigrants | Central America | 76.8 /100 | #154 | Good 6.5% |
| Inupiat | 76.7 /100 | #155 | Good 6.5% |
| Immigrants | Panama | 75.3 /100 | #156 | Good 6.5% |
| Immigrants | Sierra Leone | 75.0 /100 | #157 | Good 6.5% |
| Zimbabweans | 74.7 /100 | #158 | Good 6.5% |
| Dominicans | 73.6 /100 | #159 | Good 6.5% |
| Immigrants | Southern Europe | 72.5 /100 | #160 | Good 6.5% |
| Arabs | 72.3 /100 | #161 | Good 6.5% |
Demographics Similar to Natives/Alaskans by Disability Age 18 to 34
In terms of disability age 18 to 34, the demographic groups most similar to Natives/Alaskans are Potawatomi (8.2%, a difference of 0.020%), Sioux (8.2%, a difference of 0.14%), Delaware (8.2%, a difference of 0.19%), Cajun (8.2%, a difference of 0.52%), and French American Indian (8.2%, a difference of 0.56%).
| Demographics | Rating | Rank | Disability Age 18 to 34 |
| French Canadians | 0.0 /100 | #318 | Tragic 8.1% |
| Aleuts | 0.0 /100 | #319 | Tragic 8.1% |
| Navajo | 0.0 /100 | #320 | Tragic 8.1% |
| Blackfeet | 0.0 /100 | #321 | Tragic 8.1% |
| Cree | 0.0 /100 | #322 | Tragic 8.1% |
| French American Indians | 0.0 /100 | #323 | Tragic 8.2% |
| Cajuns | 0.0 /100 | #324 | Tragic 8.2% |
| Natives/Alaskans | 0.0 /100 | #325 | Tragic 8.2% |
| Potawatomi | 0.0 /100 | #326 | Tragic 8.2% |
| Sioux | 0.0 /100 | #327 | Tragic 8.2% |
| Delaware | 0.0 /100 | #328 | Tragic 8.2% |
| Crow | 0.0 /100 | #329 | Tragic 8.3% |
| Osage | 0.0 /100 | #330 | Tragic 8.3% |
| Comanche | 0.0 /100 | #331 | Tragic 8.3% |
| Puget Sound Salish | 0.0 /100 | #332 | Tragic 8.3% |