Scottish vs Aleut Disability Age 18 to 34
COMPARE
Scottish
Aleut
Disability Age 18 to 34
Disability Age 18 to 34 Comparison
Scottish
Aleuts
7.7%
DISABILITY AGE 18 TO 34
0.0/ 100
METRIC RATING
300th/ 347
METRIC RANK
8.1%
DISABILITY AGE 18 TO 34
0.0/ 100
METRIC RATING
319th/ 347
METRIC RANK
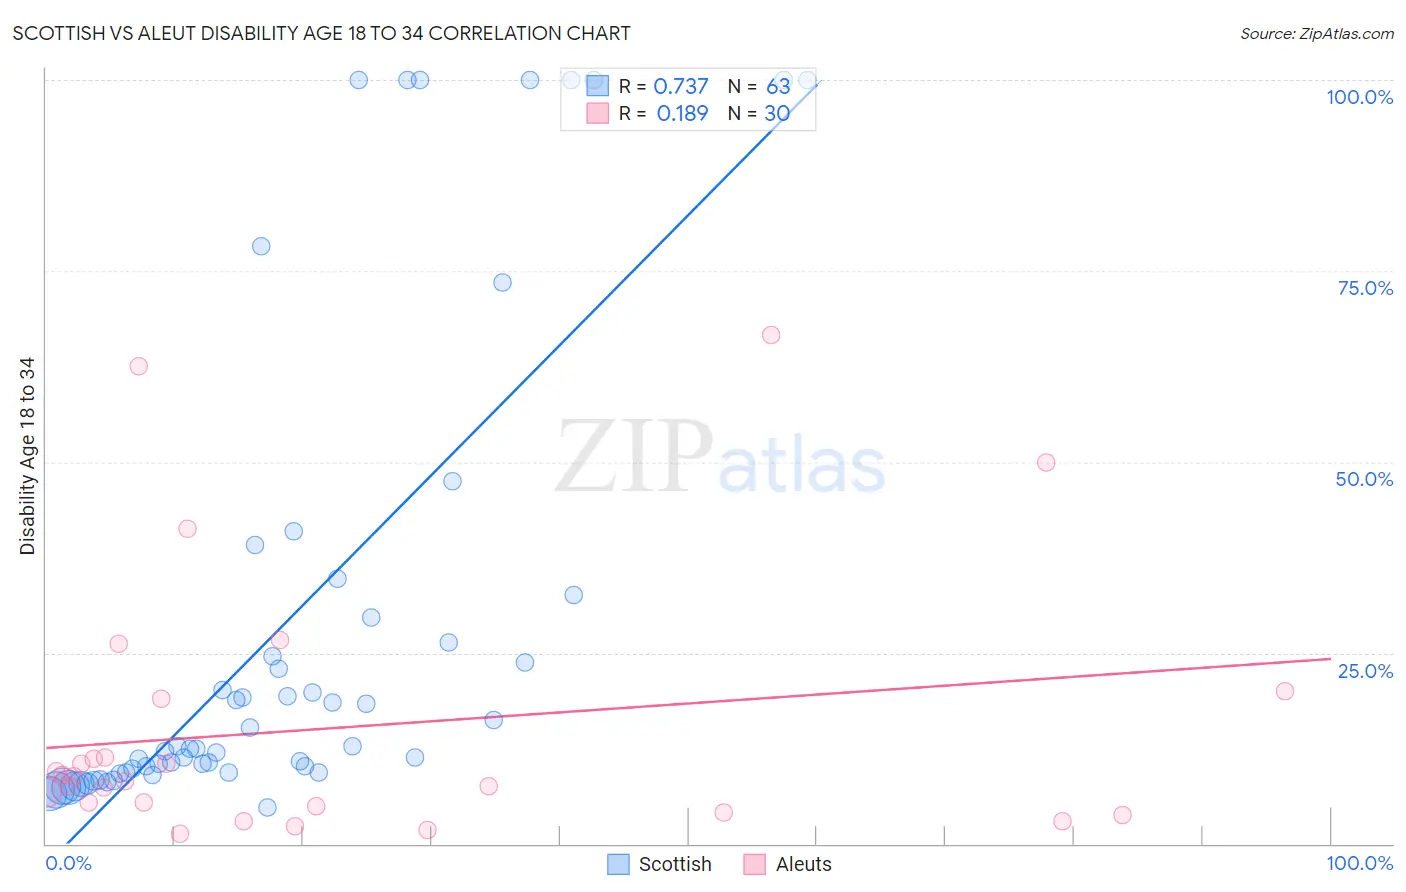
Scottish vs Aleut Disability Age 18 to 34 Correlation Chart
The statistical analysis conducted on geographies consisting of 561,209,610 people shows a strong positive correlation between the proportion of Scottish and percentage of population with a disability between the ages 18 and 35 in the United States with a correlation coefficient (R) of 0.737 and weighted average of 7.7%. Similarly, the statistical analysis conducted on geographies consisting of 61,734,200 people shows a poor positive correlation between the proportion of Aleuts and percentage of population with a disability between the ages 18 and 35 in the United States with a correlation coefficient (R) of 0.189 and weighted average of 8.1%, a difference of 4.6%.
Disability Age 18 to 34 Correlation Summary
| Measurement | Scottish | Aleut |
| Minimum | 4.8% | 1.4% |
| Maximum | 100.0% | 66.7% |
| Range | 95.2% | 65.3% |
| Mean | 28.0% | 15.2% |
| Median | 12.5% | 8.5% |
| Interquartile 25% (IQ1) | 9.3% | 4.9% |
| Interquartile 75% (IQ3) | 29.6% | 18.9% |
| Interquartile Range (IQR) | 20.3% | 14.1% |
| Standard Deviation (Sample) | 30.9% | 17.6% |
| Standard Deviation (Population) | 30.7% | 17.3% |
Demographics Similar to Scottish and Aleuts by Disability Age 18 to 34
In terms of disability age 18 to 34, the demographic groups most similar to Scottish are German (7.7%, a difference of 0.010%), Pima (7.7%, a difference of 0.060%), Welsh (7.7%, a difference of 0.14%), Cheyenne (7.7%, a difference of 0.20%), and Shoshone (7.8%, a difference of 0.54%). Similarly, the demographic groups most similar to Aleuts are French Canadian (8.1%, a difference of 0.040%), Hmong (8.1%, a difference of 0.47%), Puerto Rican (8.0%, a difference of 0.93%), American (8.0%, a difference of 1.2%), and Colville (7.9%, a difference of 1.9%).
| Demographics | Rating | Rank | Disability Age 18 to 34 |
| Germans | 0.0 /100 | #299 | Tragic 7.7% |
| Scottish | 0.0 /100 | #300 | Tragic 7.7% |
| Pima | 0.0 /100 | #301 | Tragic 7.7% |
| Welsh | 0.0 /100 | #302 | Tragic 7.7% |
| Cheyenne | 0.0 /100 | #303 | Tragic 7.7% |
| Shoshone | 0.0 /100 | #304 | Tragic 7.8% |
| Menominee | 0.0 /100 | #305 | Tragic 7.8% |
| English | 0.0 /100 | #306 | Tragic 7.8% |
| Scotch-Irish | 0.0 /100 | #307 | Tragic 7.8% |
| Pennsylvania Germans | 0.0 /100 | #308 | Tragic 7.8% |
| Alaska Natives | 0.0 /100 | #309 | Tragic 7.8% |
| Finns | 0.0 /100 | #310 | Tragic 7.8% |
| French | 0.0 /100 | #311 | Tragic 7.9% |
| Spanish Americans | 0.0 /100 | #312 | Tragic 7.9% |
| Iroquois | 0.0 /100 | #313 | Tragic 7.9% |
| Colville | 0.0 /100 | #314 | Tragic 7.9% |
| Americans | 0.0 /100 | #315 | Tragic 8.0% |
| Puerto Ricans | 0.0 /100 | #316 | Tragic 8.0% |
| Hmong | 0.0 /100 | #317 | Tragic 8.1% |
| French Canadians | 0.0 /100 | #318 | Tragic 8.1% |
| Aleuts | 0.0 /100 | #319 | Tragic 8.1% |