Immigrants from Japan vs Luxembourger Disability Age Under 5
COMPARE
Immigrants from Japan
Luxembourger
Disability Age Under 5
Disability Age Under 5 Comparison
Immigrants from Japan
Luxembourgers
1.1%
DISABILITY AGE UNDER 5
99.7/ 100
METRIC RATING
50th/ 347
METRIC RANK
1.3%
DISABILITY AGE UNDER 5
6.1/ 100
METRIC RATING
228th/ 347
METRIC RANK
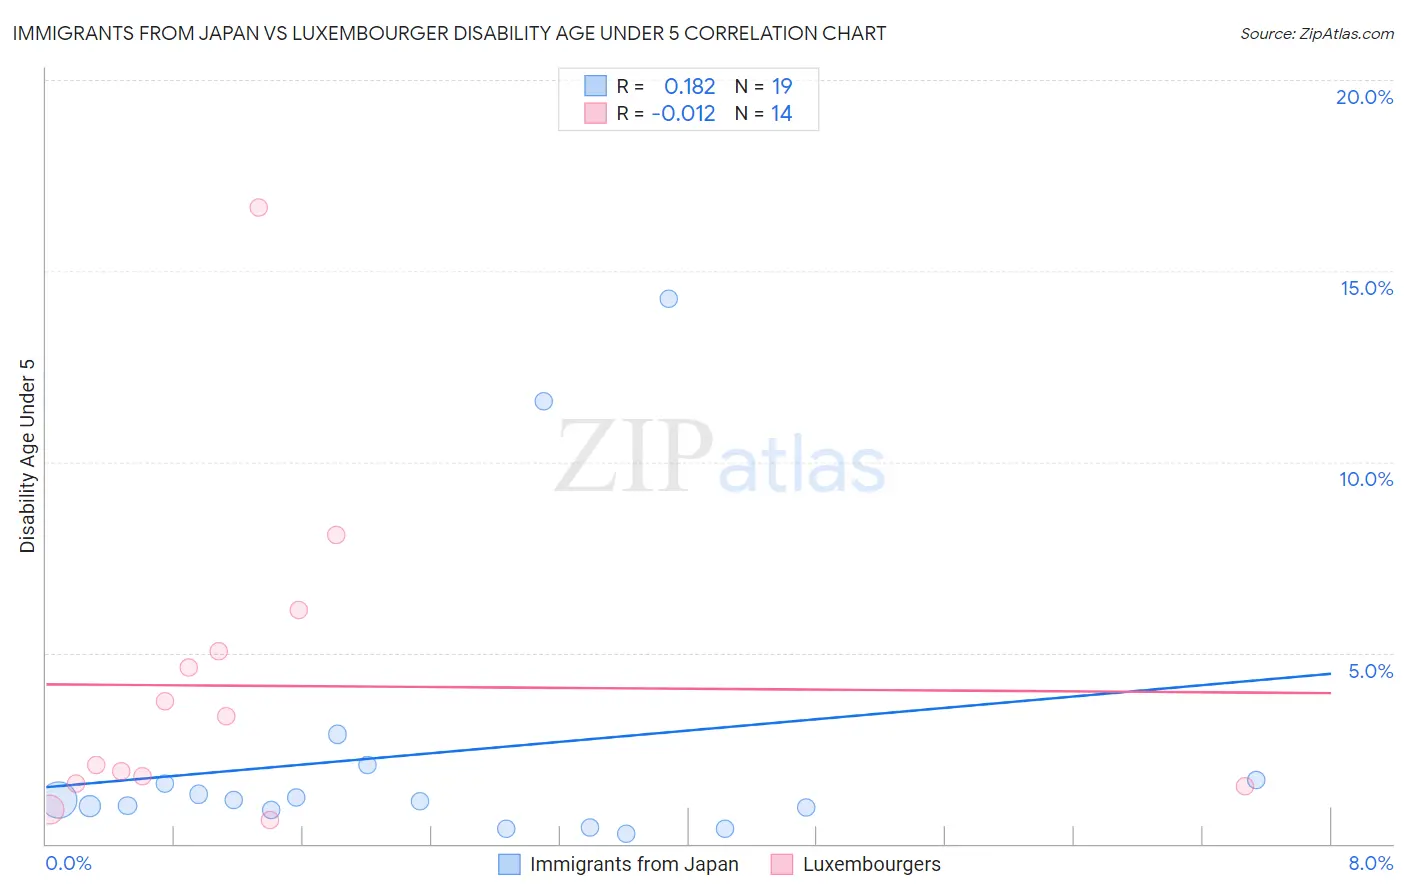
Immigrants from Japan vs Luxembourger Disability Age Under 5 Correlation Chart
The statistical analysis conducted on geographies consisting of 195,570,677 people shows a poor positive correlation between the proportion of Immigrants from Japan and percentage of population with a disability under the age of 5 in the United States with a correlation coefficient (R) of 0.182 and weighted average of 1.1%. Similarly, the statistical analysis conducted on geographies consisting of 100,355,478 people shows no correlation between the proportion of Luxembourgers and percentage of population with a disability under the age of 5 in the United States with a correlation coefficient (R) of -0.012 and weighted average of 1.3%, a difference of 22.5%.
Disability Age Under 5 Correlation Summary
| Measurement | Immigrants from Japan | Luxembourger |
| Minimum | 0.28% | 0.63% |
| Maximum | 14.3% | 16.7% |
| Range | 14.0% | 16.0% |
| Mean | 2.4% | 4.1% |
| Median | 1.1% | 2.7% |
| Interquartile 25% (IQ1) | 0.88% | 1.6% |
| Interquartile 75% (IQ3) | 1.7% | 5.0% |
| Interquartile Range (IQR) | 0.79% | 3.5% |
| Standard Deviation (Sample) | 3.8% | 4.2% |
| Standard Deviation (Population) | 3.7% | 4.0% |
Similar Demographics by Disability Age Under 5
Demographics Similar to Immigrants from Japan by Disability Age Under 5
In terms of disability age under 5, the demographic groups most similar to Immigrants from Japan are Immigrants from Russia (1.1%, a difference of 0.020%), Immigrants from Kazakhstan (1.1%, a difference of 0.19%), Immigrants from Singapore (1.1%, a difference of 0.22%), Immigrants from Sweden (1.1%, a difference of 0.44%), and Immigrants from Congo (1.1%, a difference of 0.58%).
| Demographics | Rating | Rank | Disability Age Under 5 |
| Pima | 99.8 /100 | #43 | Exceptional 1.1% |
| Immigrants | Asia | 99.8 /100 | #44 | Exceptional 1.1% |
| Immigrants | Turkey | 99.8 /100 | #45 | Exceptional 1.1% |
| Immigrants | Congo | 99.8 /100 | #46 | Exceptional 1.1% |
| Immigrants | Sweden | 99.8 /100 | #47 | Exceptional 1.1% |
| Immigrants | Singapore | 99.7 /100 | #48 | Exceptional 1.1% |
| Immigrants | Russia | 99.7 /100 | #49 | Exceptional 1.1% |
| Immigrants | Japan | 99.7 /100 | #50 | Exceptional 1.1% |
| Immigrants | Kazakhstan | 99.7 /100 | #51 | Exceptional 1.1% |
| Immigrants | Bolivia | 99.6 /100 | #52 | Exceptional 1.1% |
| Asians | 99.6 /100 | #53 | Exceptional 1.1% |
| Immigrants | El Salvador | 99.6 /100 | #54 | Exceptional 1.1% |
| Salvadorans | 99.5 /100 | #55 | Exceptional 1.1% |
| Ecuadorians | 99.5 /100 | #56 | Exceptional 1.1% |
| Assyrians/Chaldeans/Syriacs | 99.5 /100 | #57 | Exceptional 1.1% |
Demographics Similar to Luxembourgers by Disability Age Under 5
In terms of disability age under 5, the demographic groups most similar to Luxembourgers are Taiwanese (1.3%, a difference of 0.010%), Immigrants from Costa Rica (1.3%, a difference of 0.21%), Lebanese (1.3%, a difference of 0.31%), Panamanian (1.3%, a difference of 0.35%), and Bahamian (1.3%, a difference of 0.35%).
| Demographics | Rating | Rank | Disability Age Under 5 |
| Sub-Saharan Africans | 8.3 /100 | #221 | Tragic 1.3% |
| Ukrainians | 8.3 /100 | #222 | Tragic 1.3% |
| Hispanics or Latinos | 7.7 /100 | #223 | Tragic 1.3% |
| Latvians | 7.1 /100 | #224 | Tragic 1.3% |
| Panamanians | 7.1 /100 | #225 | Tragic 1.3% |
| Bahamians | 7.1 /100 | #226 | Tragic 1.3% |
| Taiwanese | 6.1 /100 | #227 | Tragic 1.3% |
| Luxembourgers | 6.1 /100 | #228 | Tragic 1.3% |
| Immigrants | Costa Rica | 5.5 /100 | #229 | Tragic 1.3% |
| Lebanese | 5.3 /100 | #230 | Tragic 1.3% |
| Immigrants | Northern Europe | 4.7 /100 | #231 | Tragic 1.3% |
| French American Indians | 4.5 /100 | #232 | Tragic 1.3% |
| Tongans | 4.2 /100 | #233 | Tragic 1.3% |
| Pueblo | 3.8 /100 | #234 | Tragic 1.3% |
| Central American Indians | 3.6 /100 | #235 | Tragic 1.3% |