Blackfeet vs Armenian Female Disability
COMPARE
Blackfeet
Armenian
Female Disability
Female Disability Comparison
Blackfeet
Armenians
13.8%
FEMALE DISABILITY
0.0/ 100
METRIC RATING
313th/ 347
METRIC RANK
12.3%
FEMALE DISABILITY
29.7/ 100
METRIC RATING
191st/ 347
METRIC RANK
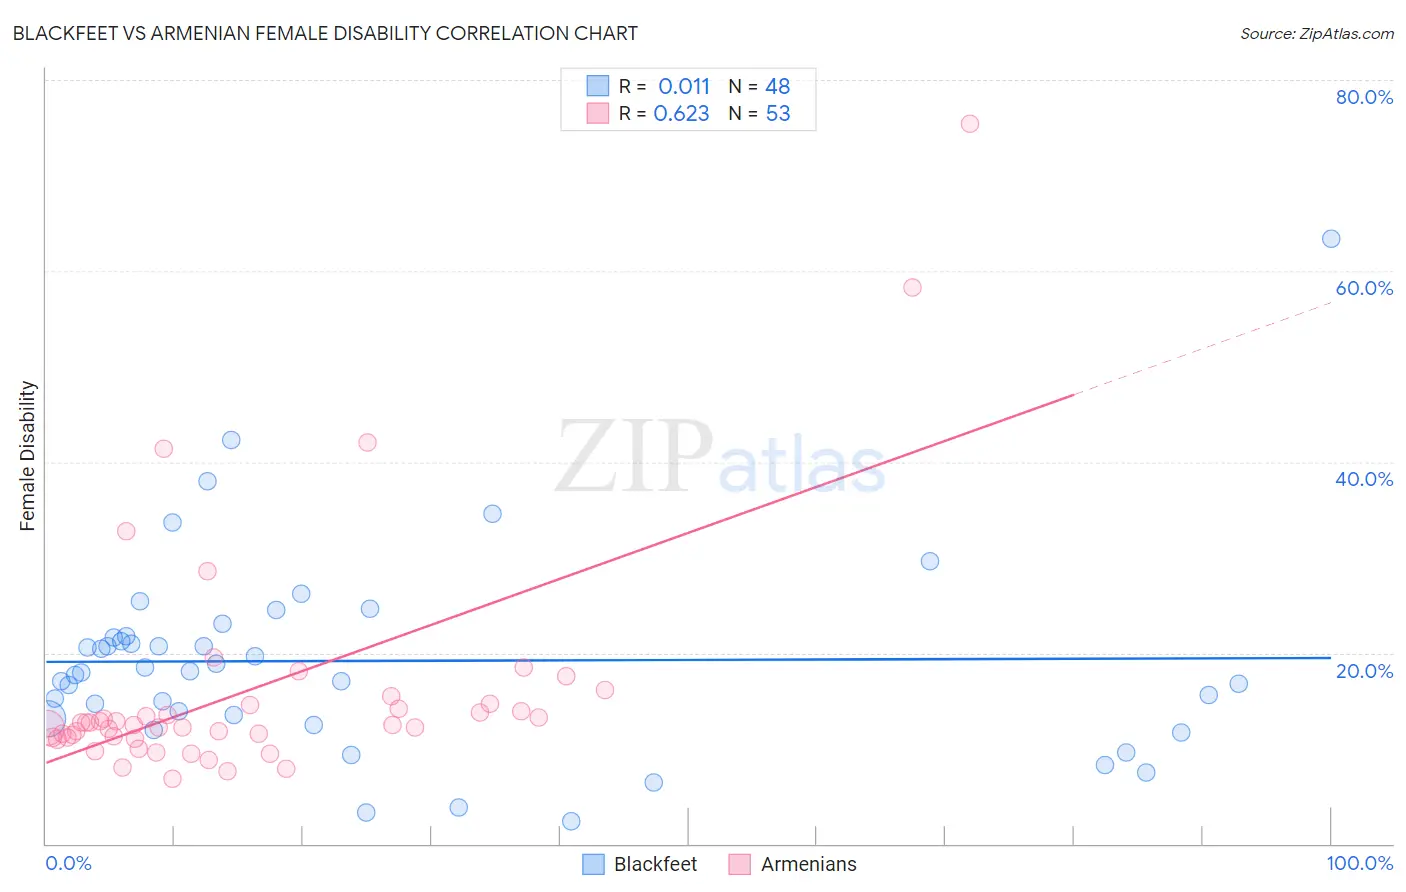
Blackfeet vs Armenian Female Disability Correlation Chart
The statistical analysis conducted on geographies consisting of 309,506,934 people shows no correlation between the proportion of Blackfeet and percentage of females with a disability in the United States with a correlation coefficient (R) of 0.011 and weighted average of 13.8%. Similarly, the statistical analysis conducted on geographies consisting of 310,925,320 people shows a significant positive correlation between the proportion of Armenians and percentage of females with a disability in the United States with a correlation coefficient (R) of 0.623 and weighted average of 12.3%, a difference of 12.5%.
Female Disability Correlation Summary
| Measurement | Blackfeet | Armenian |
| Minimum | 2.3% | 6.9% |
| Maximum | 63.4% | 75.4% |
| Range | 61.1% | 68.5% |
| Mean | 19.1% | 16.2% |
| Median | 18.0% | 12.5% |
| Interquartile 25% (IQ1) | 13.3% | 11.2% |
| Interquartile 75% (IQ3) | 21.7% | 14.6% |
| Interquartile Range (IQR) | 8.4% | 3.4% |
| Standard Deviation (Sample) | 10.6% | 12.4% |
| Standard Deviation (Population) | 10.5% | 12.3% |
Similar Demographics by Female Disability
Demographics Similar to Blackfeet by Female Disability
In terms of female disability, the demographic groups most similar to Blackfeet are Puget Sound Salish (13.8%, a difference of 0.10%), Delaware (13.8%, a difference of 0.32%), Hopi (13.7%, a difference of 0.63%), Alaskan Athabascan (13.9%, a difference of 0.69%), and Apache (13.7%, a difference of 0.91%).
| Demographics | Rating | Rank | Female Disability |
| French Canadians | 0.0 /100 | #306 | Tragic 13.6% |
| Central American Indians | 0.0 /100 | #307 | Tragic 13.6% |
| Cree | 0.0 /100 | #308 | Tragic 13.7% |
| French American Indians | 0.0 /100 | #309 | Tragic 13.7% |
| Apache | 0.0 /100 | #310 | Tragic 13.7% |
| Hopi | 0.0 /100 | #311 | Tragic 13.7% |
| Delaware | 0.0 /100 | #312 | Tragic 13.8% |
| Blackfeet | 0.0 /100 | #313 | Tragic 13.8% |
| Puget Sound Salish | 0.0 /100 | #314 | Tragic 13.8% |
| Alaskan Athabascans | 0.0 /100 | #315 | Tragic 13.9% |
| Spanish Americans | 0.0 /100 | #316 | Tragic 14.0% |
| Chippewa | 0.0 /100 | #317 | Tragic 14.0% |
| Paiute | 0.0 /100 | #318 | Tragic 14.0% |
| Iroquois | 0.0 /100 | #319 | Tragic 14.0% |
| Americans | 0.0 /100 | #320 | Tragic 14.1% |
Demographics Similar to Armenians by Female Disability
In terms of female disability, the demographic groups most similar to Armenians are Immigrants from Western Africa (12.3%, a difference of 0.020%), Immigrants from Honduras (12.3%, a difference of 0.070%), Immigrants from Albania (12.3%, a difference of 0.080%), Northern European (12.3%, a difference of 0.10%), and Ukrainian (12.3%, a difference of 0.11%).
| Demographics | Rating | Rank | Female Disability |
| Iraqis | 36.0 /100 | #184 | Fair 12.3% |
| Immigrants | Uzbekistan | 33.9 /100 | #185 | Fair 12.3% |
| Austrians | 33.3 /100 | #186 | Fair 12.3% |
| Serbians | 33.1 /100 | #187 | Fair 12.3% |
| Immigrants | North America | 32.8 /100 | #188 | Fair 12.3% |
| Immigrants | Albania | 31.6 /100 | #189 | Fair 12.3% |
| Immigrants | Honduras | 31.3 /100 | #190 | Fair 12.3% |
| Armenians | 29.7 /100 | #191 | Fair 12.3% |
| Immigrants | Western Africa | 29.2 /100 | #192 | Fair 12.3% |
| Northern Europeans | 27.5 /100 | #193 | Fair 12.3% |
| Ukrainians | 27.2 /100 | #194 | Fair 12.3% |
| Swedes | 26.6 /100 | #195 | Fair 12.3% |
| Immigrants | Panama | 25.5 /100 | #196 | Fair 12.3% |
| Hondurans | 25.4 /100 | #197 | Fair 12.3% |
| Mexican American Indians | 24.9 /100 | #198 | Fair 12.3% |