Blackfeet vs Iranian Female Disability
COMPARE
Blackfeet
Iranian
Female Disability
Female Disability Comparison
Blackfeet
Iranians
13.8%
FEMALE DISABILITY
0.0/ 100
METRIC RATING
313th/ 347
METRIC RANK
10.6%
FEMALE DISABILITY
100.0/ 100
METRIC RATING
9th/ 347
METRIC RANK
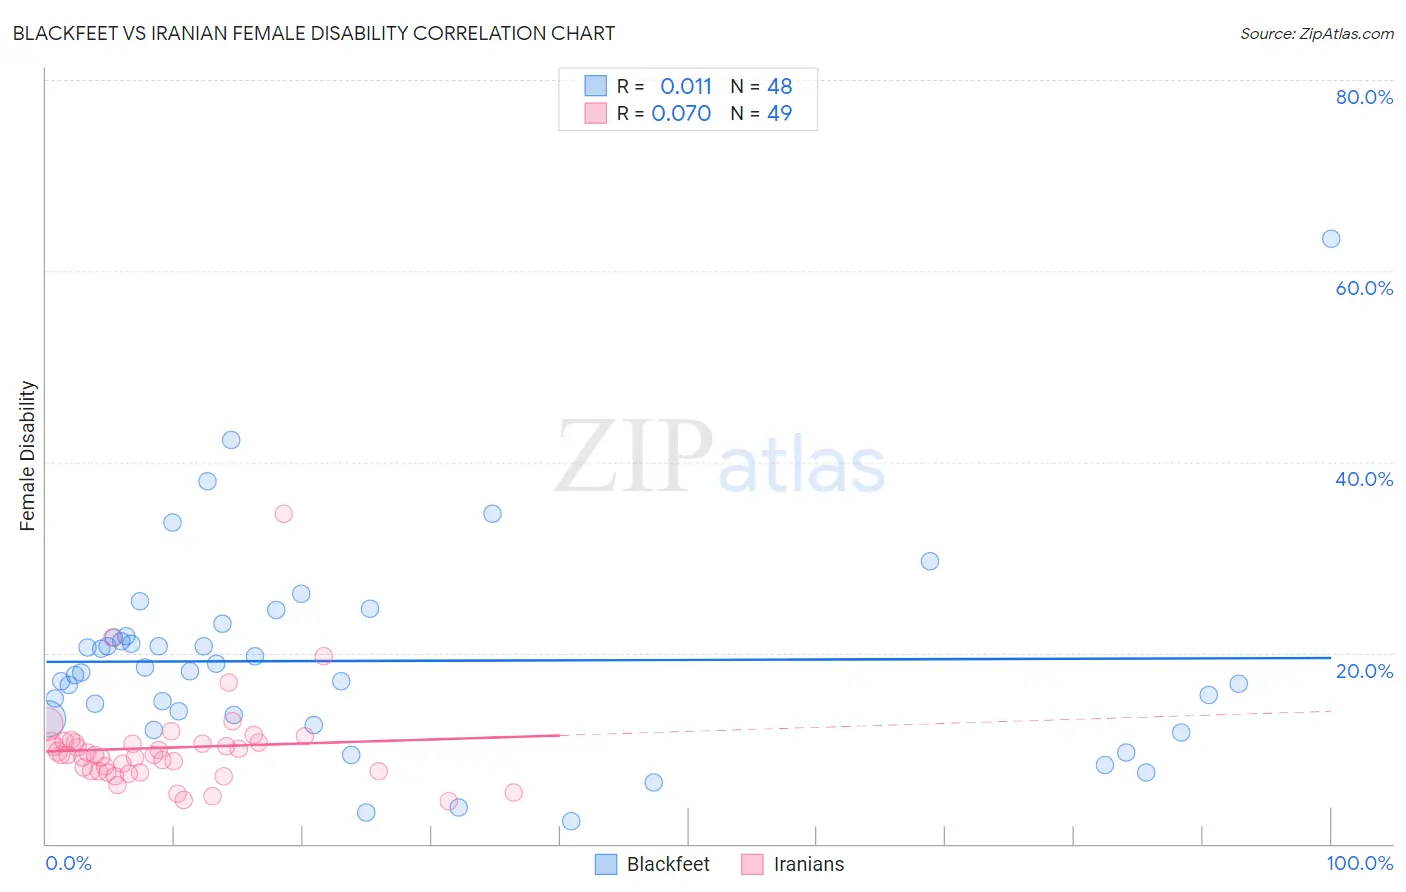
Blackfeet vs Iranian Female Disability Correlation Chart
The statistical analysis conducted on geographies consisting of 309,506,934 people shows no correlation between the proportion of Blackfeet and percentage of females with a disability in the United States with a correlation coefficient (R) of 0.011 and weighted average of 13.8%. Similarly, the statistical analysis conducted on geographies consisting of 316,876,376 people shows a slight positive correlation between the proportion of Iranians and percentage of females with a disability in the United States with a correlation coefficient (R) of 0.070 and weighted average of 10.6%, a difference of 31.1%.
Female Disability Correlation Summary
| Measurement | Blackfeet | Iranian |
| Minimum | 2.3% | 4.5% |
| Maximum | 63.4% | 34.6% |
| Range | 61.1% | 30.1% |
| Mean | 19.1% | 10.0% |
| Median | 18.0% | 9.3% |
| Interquartile 25% (IQ1) | 13.3% | 7.6% |
| Interquartile 75% (IQ3) | 21.7% | 10.6% |
| Interquartile Range (IQR) | 8.4% | 3.1% |
| Standard Deviation (Sample) | 10.6% | 4.8% |
| Standard Deviation (Population) | 10.5% | 4.8% |
Similar Demographics by Female Disability
Demographics Similar to Blackfeet by Female Disability
In terms of female disability, the demographic groups most similar to Blackfeet are Puget Sound Salish (13.8%, a difference of 0.10%), Delaware (13.8%, a difference of 0.32%), Hopi (13.7%, a difference of 0.63%), Alaskan Athabascan (13.9%, a difference of 0.69%), and Apache (13.7%, a difference of 0.91%).
| Demographics | Rating | Rank | Female Disability |
| French Canadians | 0.0 /100 | #306 | Tragic 13.6% |
| Central American Indians | 0.0 /100 | #307 | Tragic 13.6% |
| Cree | 0.0 /100 | #308 | Tragic 13.7% |
| French American Indians | 0.0 /100 | #309 | Tragic 13.7% |
| Apache | 0.0 /100 | #310 | Tragic 13.7% |
| Hopi | 0.0 /100 | #311 | Tragic 13.7% |
| Delaware | 0.0 /100 | #312 | Tragic 13.8% |
| Blackfeet | 0.0 /100 | #313 | Tragic 13.8% |
| Puget Sound Salish | 0.0 /100 | #314 | Tragic 13.8% |
| Alaskan Athabascans | 0.0 /100 | #315 | Tragic 13.9% |
| Spanish Americans | 0.0 /100 | #316 | Tragic 14.0% |
| Chippewa | 0.0 /100 | #317 | Tragic 14.0% |
| Paiute | 0.0 /100 | #318 | Tragic 14.0% |
| Iroquois | 0.0 /100 | #319 | Tragic 14.0% |
| Americans | 0.0 /100 | #320 | Tragic 14.1% |
Demographics Similar to Iranians by Female Disability
In terms of female disability, the demographic groups most similar to Iranians are Immigrants from Hong Kong (10.6%, a difference of 0.65%), Immigrants from Korea (10.6%, a difference of 0.82%), Immigrants from South Central Asia (10.5%, a difference of 0.91%), Immigrants from Singapore (10.4%, a difference of 1.1%), and Immigrants from Israel (10.7%, a difference of 1.2%).
| Demographics | Rating | Rank | Female Disability |
| Filipinos | 100.0 /100 | #2 | Exceptional 10.1% |
| Immigrants | Taiwan | 100.0 /100 | #3 | Exceptional 10.1% |
| Thais | 100.0 /100 | #4 | Exceptional 10.2% |
| Immigrants | Bolivia | 100.0 /100 | #5 | Exceptional 10.3% |
| Bolivians | 100.0 /100 | #6 | Exceptional 10.4% |
| Immigrants | Singapore | 100.0 /100 | #7 | Exceptional 10.4% |
| Immigrants | South Central Asia | 100.0 /100 | #8 | Exceptional 10.5% |
| Iranians | 100.0 /100 | #9 | Exceptional 10.6% |
| Immigrants | Hong Kong | 100.0 /100 | #10 | Exceptional 10.6% |
| Immigrants | Korea | 100.0 /100 | #11 | Exceptional 10.6% |
| Immigrants | Israel | 100.0 /100 | #12 | Exceptional 10.7% |
| Immigrants | Eastern Asia | 100.0 /100 | #13 | Exceptional 10.7% |
| Immigrants | China | 100.0 /100 | #14 | Exceptional 10.7% |
| Burmese | 100.0 /100 | #15 | Exceptional 10.7% |
| Okinawans | 100.0 /100 | #16 | Exceptional 10.8% |