Immigrants from Uruguay vs Immigrants from Morocco Disability Age Under 5
COMPARE
Immigrants from Uruguay
Immigrants from Morocco
Disability Age Under 5
Disability Age Under 5 Comparison
Immigrants from Uruguay
Immigrants from Morocco
1.2%
DISABILITY AGE UNDER 5
59.0/ 100
METRIC RATING
169th/ 347
METRIC RANK
1.2%
DISABILITY AGE UNDER 5
96.0/ 100
METRIC RATING
102nd/ 347
METRIC RANK
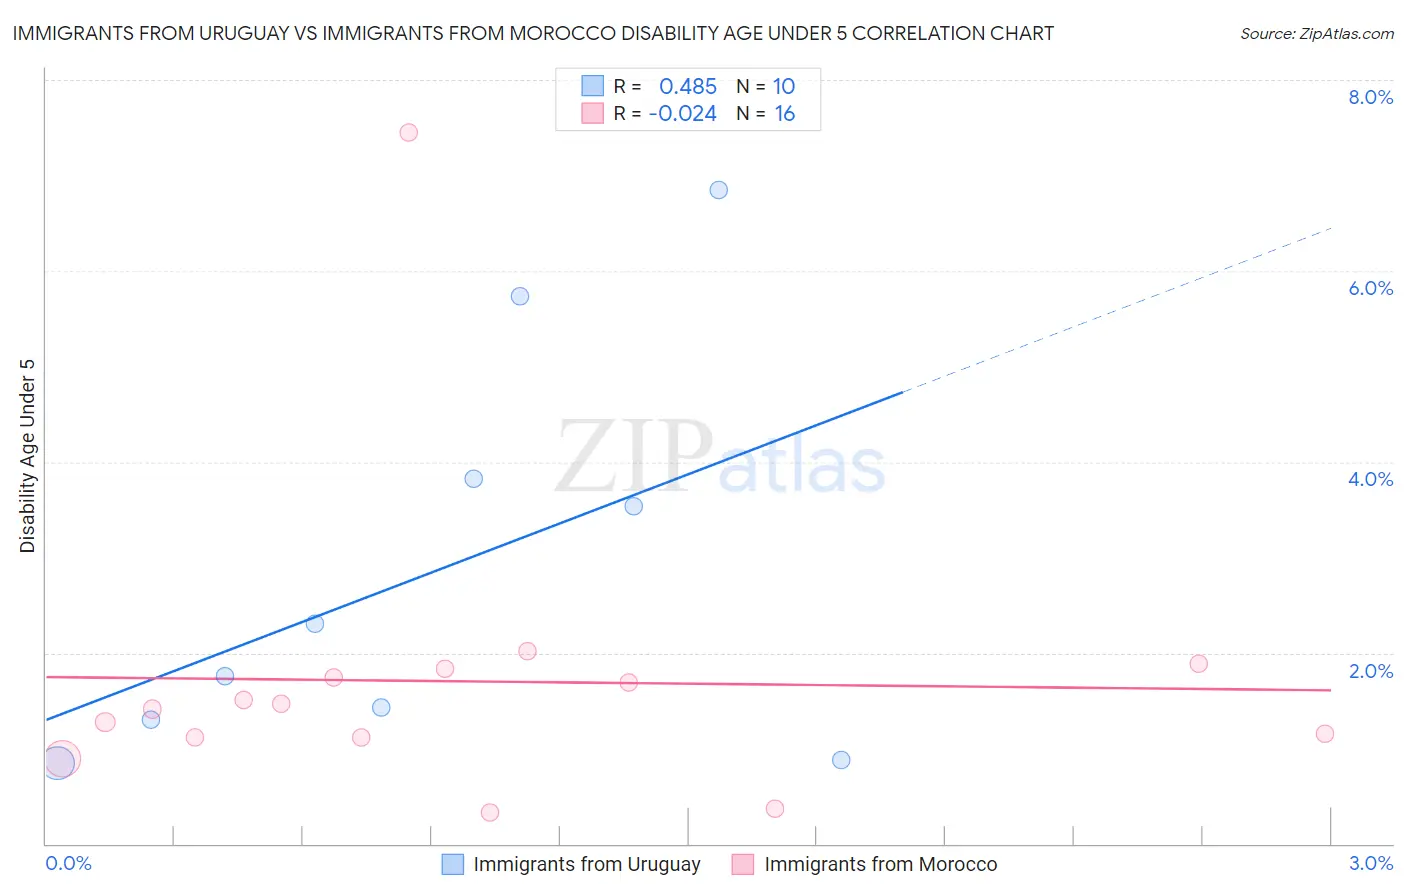
Immigrants from Uruguay vs Immigrants from Morocco Disability Age Under 5 Correlation Chart
The statistical analysis conducted on geographies consisting of 93,497,265 people shows a moderate positive correlation between the proportion of Immigrants from Uruguay and percentage of population with a disability under the age of 5 in the United States with a correlation coefficient (R) of 0.485 and weighted average of 1.2%. Similarly, the statistical analysis conducted on geographies consisting of 120,271,602 people shows no correlation between the proportion of Immigrants from Morocco and percentage of population with a disability under the age of 5 in the United States with a correlation coefficient (R) of -0.024 and weighted average of 1.2%, a difference of 6.9%.
Disability Age Under 5 Correlation Summary
| Measurement | Immigrants from Uruguay | Immigrants from Morocco |
| Minimum | 0.84% | 0.32% |
| Maximum | 6.8% | 7.4% |
| Range | 6.0% | 7.1% |
| Mean | 2.8% | 1.7% |
| Median | 2.0% | 1.4% |
| Interquartile 25% (IQ1) | 1.3% | 1.1% |
| Interquartile 75% (IQ3) | 3.8% | 1.8% |
| Interquartile Range (IQR) | 2.5% | 0.68% |
| Standard Deviation (Sample) | 2.1% | 1.6% |
| Standard Deviation (Population) | 2.0% | 1.6% |
Similar Demographics by Disability Age Under 5
Demographics Similar to Immigrants from Uruguay by Disability Age Under 5
In terms of disability age under 5, the demographic groups most similar to Immigrants from Uruguay are Sierra Leonean (1.2%, a difference of 0.010%), Immigrants from Jamaica (1.2%, a difference of 0.020%), Guamanian/Chamorro (1.2%, a difference of 0.11%), Immigrants from Argentina (1.2%, a difference of 0.12%), and Immigrants from Central America (1.2%, a difference of 0.23%).
| Demographics | Rating | Rank | Disability Age Under 5 |
| Guatemalans | 63.6 /100 | #162 | Good 1.2% |
| Immigrants | Guatemala | 63.2 /100 | #163 | Good 1.2% |
| Laotians | 62.8 /100 | #164 | Good 1.2% |
| Immigrants | Kuwait | 62.6 /100 | #165 | Good 1.2% |
| Immigrants | Central America | 61.4 /100 | #166 | Good 1.2% |
| Immigrants | Argentina | 60.2 /100 | #167 | Good 1.2% |
| Sierra Leoneans | 59.1 /100 | #168 | Average 1.2% |
| Immigrants | Uruguay | 59.0 /100 | #169 | Average 1.2% |
| Immigrants | Jamaica | 58.8 /100 | #170 | Average 1.2% |
| Guamanians/Chamorros | 57.8 /100 | #171 | Average 1.2% |
| Crow | 51.0 /100 | #172 | Average 1.2% |
| Immigrants | Ireland | 50.3 /100 | #173 | Average 1.2% |
| Immigrants | Latvia | 50.0 /100 | #174 | Average 1.2% |
| Immigrants | Nigeria | 50.0 /100 | #175 | Average 1.2% |
| Immigrants | Kenya | 48.6 /100 | #176 | Average 1.2% |
Demographics Similar to Immigrants from Morocco by Disability Age Under 5
In terms of disability age under 5, the demographic groups most similar to Immigrants from Morocco are Immigrants from Nicaragua (1.2%, a difference of 0.0%), Immigrants from Uganda (1.1%, a difference of 0.060%), Indonesian (1.2%, a difference of 0.070%), Nicaraguan (1.1%, a difference of 0.17%), and Dominican (1.1%, a difference of 0.20%).
| Demographics | Rating | Rank | Disability Age Under 5 |
| Immigrants | Moldova | 96.8 /100 | #95 | Exceptional 1.1% |
| Mongolians | 96.6 /100 | #96 | Exceptional 1.1% |
| Immigrants | Iraq | 96.5 /100 | #97 | Exceptional 1.1% |
| Immigrants | South Eastern Asia | 96.5 /100 | #98 | Exceptional 1.1% |
| Dominicans | 96.3 /100 | #99 | Exceptional 1.1% |
| Nicaraguans | 96.3 /100 | #100 | Exceptional 1.1% |
| Immigrants | Uganda | 96.1 /100 | #101 | Exceptional 1.1% |
| Immigrants | Morocco | 96.0 /100 | #102 | Exceptional 1.2% |
| Immigrants | Nicaragua | 96.0 /100 | #103 | Exceptional 1.2% |
| Indonesians | 95.9 /100 | #104 | Exceptional 1.2% |
| Immigrants | South Africa | 95.6 /100 | #105 | Exceptional 1.2% |
| Cambodians | 95.4 /100 | #106 | Exceptional 1.2% |
| Immigrants | West Indies | 95.3 /100 | #107 | Exceptional 1.2% |
| Iraqis | 95.1 /100 | #108 | Exceptional 1.2% |
| Immigrants | Panama | 95.0 /100 | #109 | Exceptional 1.2% |