Bhutanese vs Spanish Cognitive Disability
COMPARE
Bhutanese
Spanish
Cognitive Disability
Cognitive Disability Comparison
Bhutanese
Spanish
16.6%
COGNITIVE DISABILITY
99.7/ 100
METRIC RATING
57th/ 347
METRIC RANK
17.3%
COGNITIVE DISABILITY
48.9/ 100
METRIC RATING
178th/ 347
METRIC RANK
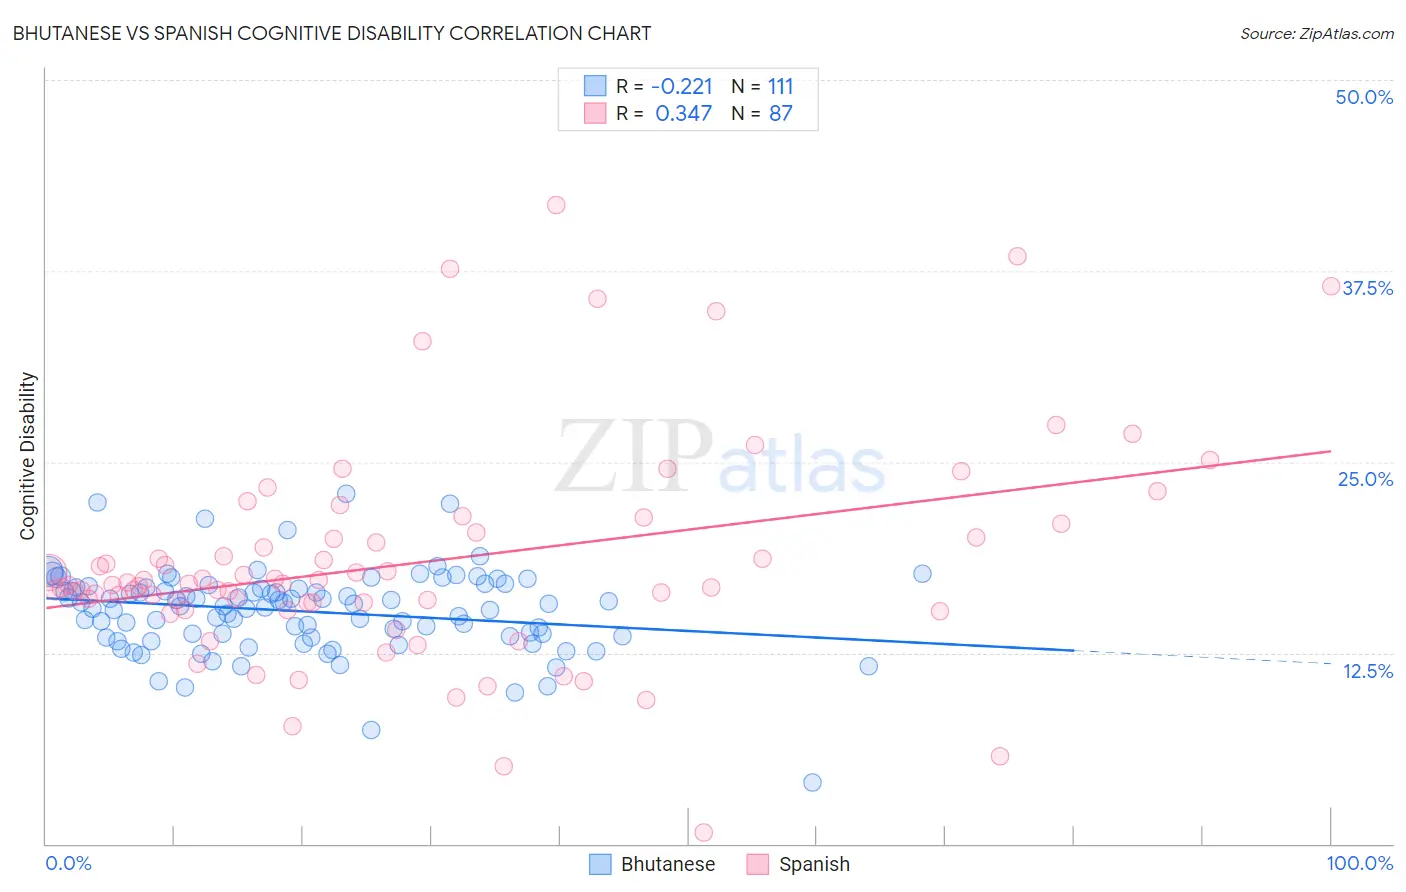
Bhutanese vs Spanish Cognitive Disability Correlation Chart
The statistical analysis conducted on geographies consisting of 455,511,378 people shows a weak negative correlation between the proportion of Bhutanese and percentage of population with cognitive disability in the United States with a correlation coefficient (R) of -0.221 and weighted average of 16.6%. Similarly, the statistical analysis conducted on geographies consisting of 422,108,205 people shows a mild positive correlation between the proportion of Spanish and percentage of population with cognitive disability in the United States with a correlation coefficient (R) of 0.347 and weighted average of 17.3%, a difference of 4.3%.
Cognitive Disability Correlation Summary
| Measurement | Bhutanese | Spanish |
| Minimum | 4.0% | 0.76% |
| Maximum | 22.9% | 41.8% |
| Range | 18.9% | 41.1% |
| Mean | 15.2% | 18.4% |
| Median | 15.6% | 17.0% |
| Interquartile 25% (IQ1) | 13.6% | 15.8% |
| Interquartile 75% (IQ3) | 16.8% | 20.4% |
| Interquartile Range (IQR) | 3.2% | 4.6% |
| Standard Deviation (Sample) | 2.8% | 7.2% |
| Standard Deviation (Population) | 2.7% | 7.2% |
Similar Demographics by Cognitive Disability
Demographics Similar to Bhutanese by Cognitive Disability
In terms of cognitive disability, the demographic groups most similar to Bhutanese are Austrian (16.6%, a difference of 0.010%), Pennsylvania German (16.6%, a difference of 0.080%), Immigrants from Peru (16.6%, a difference of 0.080%), Romanian (16.6%, a difference of 0.090%), and Immigrants from Venezuela (16.5%, a difference of 0.10%).
| Demographics | Rating | Rank | Cognitive Disability |
| Norwegians | 99.8 /100 | #50 | Exceptional 16.5% |
| Immigrants | Korea | 99.8 /100 | #51 | Exceptional 16.5% |
| Soviet Union | 99.8 /100 | #52 | Exceptional 16.5% |
| Swedes | 99.8 /100 | #53 | Exceptional 16.5% |
| Immigrants | Iran | 99.8 /100 | #54 | Exceptional 16.5% |
| Immigrants | Venezuela | 99.7 /100 | #55 | Exceptional 16.5% |
| Austrians | 99.7 /100 | #56 | Exceptional 16.6% |
| Bhutanese | 99.7 /100 | #57 | Exceptional 16.6% |
| Pennsylvania Germans | 99.7 /100 | #58 | Exceptional 16.6% |
| Immigrants | Peru | 99.7 /100 | #59 | Exceptional 16.6% |
| Romanians | 99.7 /100 | #60 | Exceptional 16.6% |
| Immigrants | England | 99.6 /100 | #61 | Exceptional 16.6% |
| Czechoslovakians | 99.6 /100 | #62 | Exceptional 16.6% |
| Argentineans | 99.6 /100 | #63 | Exceptional 16.6% |
| Venezuelans | 99.6 /100 | #64 | Exceptional 16.6% |
Demographics Similar to Spanish by Cognitive Disability
In terms of cognitive disability, the demographic groups most similar to Spanish are Ute (17.3%, a difference of 0.0%), Shoshone (17.3%, a difference of 0.010%), Sioux (17.3%, a difference of 0.010%), Tsimshian (17.3%, a difference of 0.020%), and Laotian (17.3%, a difference of 0.030%).
| Demographics | Rating | Rank | Cognitive Disability |
| Tlingit-Haida | 59.4 /100 | #171 | Average 17.2% |
| Immigrants | Turkey | 56.7 /100 | #172 | Average 17.2% |
| Immigrants | Northern Africa | 50.2 /100 | #173 | Average 17.3% |
| Laotians | 50.0 /100 | #174 | Average 17.3% |
| Tsimshian | 49.8 /100 | #175 | Average 17.3% |
| Shoshone | 49.2 /100 | #176 | Average 17.3% |
| Ute | 49.1 /100 | #177 | Average 17.3% |
| Spanish | 48.9 /100 | #178 | Average 17.3% |
| Sioux | 48.6 /100 | #179 | Average 17.3% |
| Pakistanis | 43.9 /100 | #180 | Average 17.3% |
| Immigrants | Guyana | 42.9 /100 | #181 | Average 17.3% |
| Arabs | 42.8 /100 | #182 | Average 17.3% |
| Spaniards | 40.3 /100 | #183 | Average 17.3% |
| Crow | 39.1 /100 | #184 | Fair 17.3% |
| Afghans | 38.2 /100 | #185 | Fair 17.3% |