Bermudan vs Immigrants from Uganda Vision Disability
COMPARE
Bermudan
Immigrants from Uganda
Vision Disability
Vision Disability Comparison
Bermudans
Immigrants from Uganda
2.2%
VISION DISABILITY
9.0/ 100
METRIC RATING
212th/ 347
METRIC RANK
2.1%
VISION DISABILITY
91.4/ 100
METRIC RATING
119th/ 347
METRIC RANK
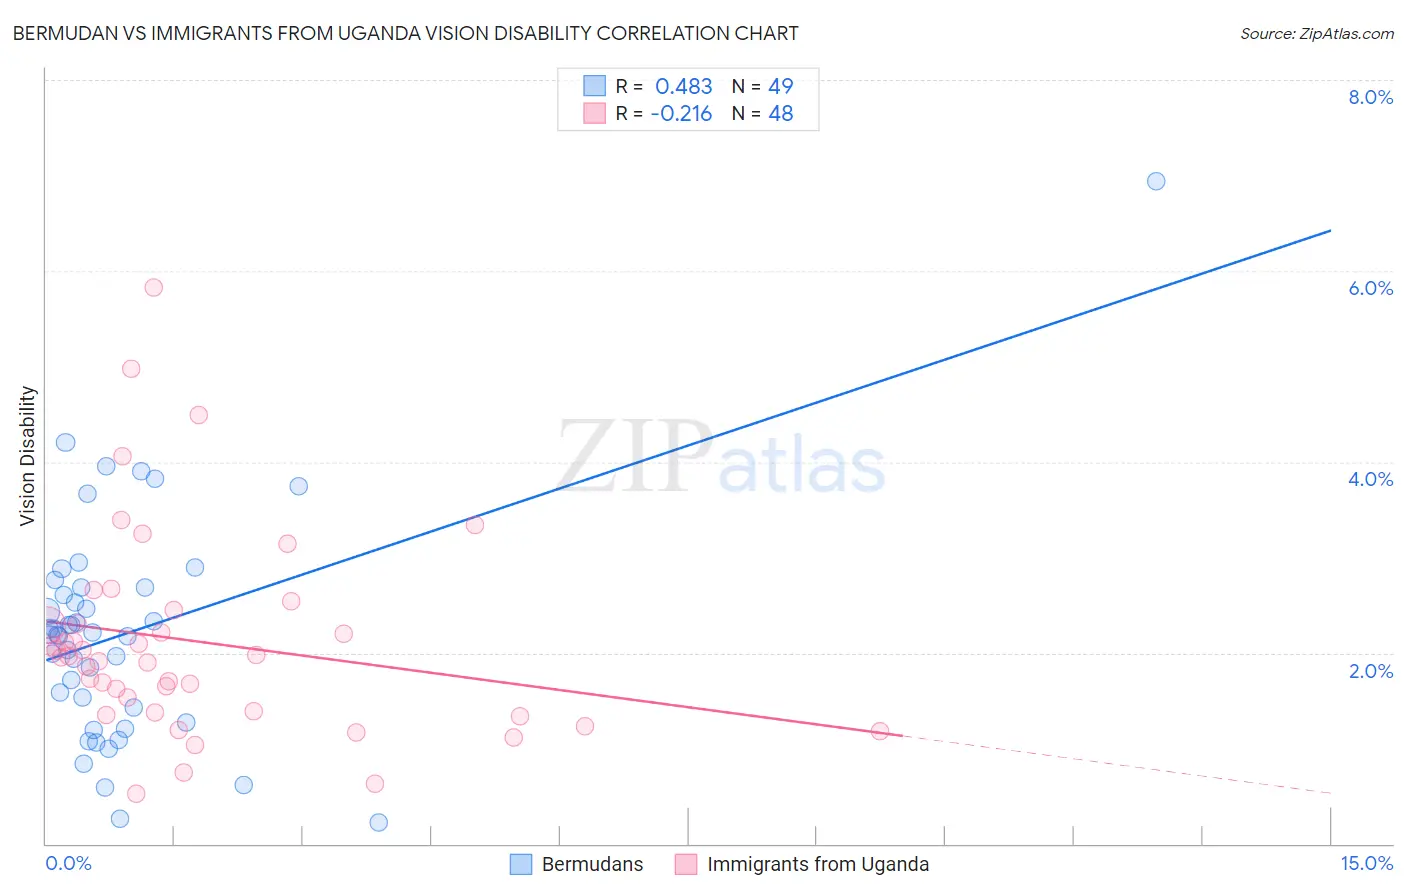
Bermudan vs Immigrants from Uganda Vision Disability Correlation Chart
The statistical analysis conducted on geographies consisting of 55,718,331 people shows a moderate positive correlation between the proportion of Bermudans and percentage of population with vision disability in the United States with a correlation coefficient (R) of 0.483 and weighted average of 2.2%. Similarly, the statistical analysis conducted on geographies consisting of 125,949,603 people shows a weak negative correlation between the proportion of Immigrants from Uganda and percentage of population with vision disability in the United States with a correlation coefficient (R) of -0.216 and weighted average of 2.1%, a difference of 7.6%.
Vision Disability Correlation Summary
| Measurement | Bermudan | Immigrants from Uganda |
| Minimum | 0.22% | 0.52% |
| Maximum | 6.9% | 5.8% |
| Range | 6.7% | 5.3% |
| Mean | 2.2% | 2.1% |
| Median | 2.2% | 2.0% |
| Interquartile 25% (IQ1) | 1.3% | 1.4% |
| Interquartile 75% (IQ3) | 2.7% | 2.4% |
| Interquartile Range (IQR) | 1.3% | 0.99% |
| Standard Deviation (Sample) | 1.2% | 1.1% |
| Standard Deviation (Population) | 1.2% | 1.1% |
Similar Demographics by Vision Disability
Demographics Similar to Bermudans by Vision Disability
In terms of vision disability, the demographic groups most similar to Bermudans are Immigrants from Ghana (2.2%, a difference of 0.010%), Indonesian (2.2%, a difference of 0.090%), Trinidadian and Tobagonian (2.2%, a difference of 0.14%), Nigerian (2.3%, a difference of 0.35%), and Immigrants from Uruguay (2.2%, a difference of 0.43%).
| Demographics | Rating | Rank | Vision Disability |
| Samoans | 15.7 /100 | #205 | Poor 2.2% |
| Pennsylvania Germans | 14.5 /100 | #206 | Poor 2.2% |
| Immigrants | Nigeria | 13.5 /100 | #207 | Poor 2.2% |
| Germans | 13.4 /100 | #208 | Poor 2.2% |
| Immigrants | Brazil | 13.1 /100 | #209 | Poor 2.2% |
| Immigrants | Uruguay | 11.5 /100 | #210 | Poor 2.2% |
| Indonesians | 9.5 /100 | #211 | Tragic 2.2% |
| Bermudans | 9.0 /100 | #212 | Tragic 2.2% |
| Immigrants | Ghana | 8.9 /100 | #213 | Tragic 2.2% |
| Trinidadians and Tobagonians | 8.2 /100 | #214 | Tragic 2.2% |
| Nigerians | 7.2 /100 | #215 | Tragic 2.3% |
| Immigrants | Trinidad and Tobago | 6.1 /100 | #216 | Tragic 2.3% |
| Barbadians | 5.1 /100 | #217 | Tragic 2.3% |
| Portuguese | 4.9 /100 | #218 | Tragic 2.3% |
| Ecuadorians | 4.6 /100 | #219 | Tragic 2.3% |
Demographics Similar to Immigrants from Uganda by Vision Disability
In terms of vision disability, the demographic groups most similar to Immigrants from Uganda are Immigrants from Philippines (2.1%, a difference of 0.0%), Immigrants from Zimbabwe (2.1%, a difference of 0.060%), Polish (2.1%, a difference of 0.14%), Ugandan (2.1%, a difference of 0.18%), and Immigrants from Vietnam (2.1%, a difference of 0.19%).
| Demographics | Rating | Rank | Vision Disability |
| Immigrants | Denmark | 92.9 /100 | #112 | Exceptional 2.1% |
| Kenyans | 92.5 /100 | #113 | Exceptional 2.1% |
| Croatians | 92.3 /100 | #114 | Exceptional 2.1% |
| Immigrants | Vietnam | 92.2 /100 | #115 | Exceptional 2.1% |
| Ugandans | 92.2 /100 | #116 | Exceptional 2.1% |
| Poles | 92.0 /100 | #117 | Exceptional 2.1% |
| Immigrants | Philippines | 91.4 /100 | #118 | Exceptional 2.1% |
| Immigrants | Uganda | 91.4 /100 | #119 | Exceptional 2.1% |
| Immigrants | Zimbabwe | 91.0 /100 | #120 | Exceptional 2.1% |
| Immigrants | Scotland | 90.4 /100 | #121 | Exceptional 2.1% |
| Immigrants | Ukraine | 90.4 /100 | #122 | Exceptional 2.1% |
| Immigrants | Albania | 90.4 /100 | #123 | Exceptional 2.1% |
| Immigrants | Spain | 89.8 /100 | #124 | Excellent 2.1% |
| Immigrants | Venezuela | 89.8 /100 | #125 | Excellent 2.1% |
| Immigrants | Peru | 89.5 /100 | #126 | Excellent 2.1% |