Bermudan vs Marshallese Vision Disability
COMPARE
Bermudan
Marshallese
Vision Disability
Vision Disability Comparison
Bermudans
Marshallese
2.2%
VISION DISABILITY
9.0/ 100
METRIC RATING
212th/ 347
METRIC RANK
2.3%
VISION DISABILITY
1.5/ 100
METRIC RATING
235th/ 347
METRIC RANK
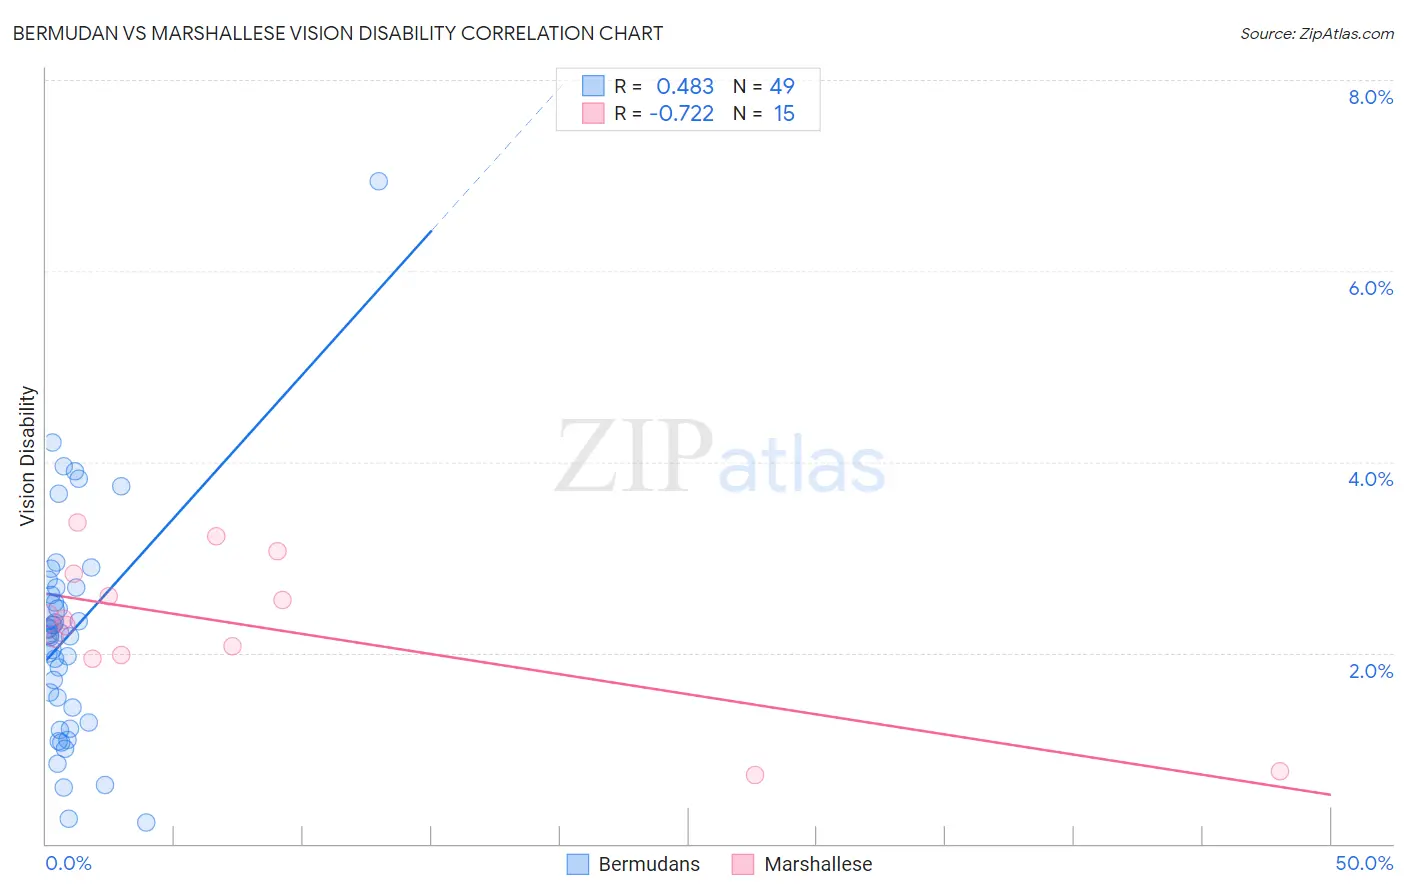
Bermudan vs Marshallese Vision Disability Correlation Chart
The statistical analysis conducted on geographies consisting of 55,718,331 people shows a moderate positive correlation between the proportion of Bermudans and percentage of population with vision disability in the United States with a correlation coefficient (R) of 0.483 and weighted average of 2.2%. Similarly, the statistical analysis conducted on geographies consisting of 14,759,042 people shows a strong negative correlation between the proportion of Marshallese and percentage of population with vision disability in the United States with a correlation coefficient (R) of -0.722 and weighted average of 2.3%, a difference of 2.9%.
Vision Disability Correlation Summary
| Measurement | Bermudan | Marshallese |
| Minimum | 0.22% | 0.72% |
| Maximum | 6.9% | 3.4% |
| Range | 6.7% | 2.6% |
| Mean | 2.2% | 2.3% |
| Median | 2.2% | 2.4% |
| Interquartile 25% (IQ1) | 1.3% | 2.0% |
| Interquartile 75% (IQ3) | 2.7% | 2.8% |
| Interquartile Range (IQR) | 1.3% | 0.86% |
| Standard Deviation (Sample) | 1.2% | 0.76% |
| Standard Deviation (Population) | 1.2% | 0.74% |
Similar Demographics by Vision Disability
Demographics Similar to Bermudans by Vision Disability
In terms of vision disability, the demographic groups most similar to Bermudans are Immigrants from Ghana (2.2%, a difference of 0.010%), Indonesian (2.2%, a difference of 0.090%), Trinidadian and Tobagonian (2.2%, a difference of 0.14%), Nigerian (2.3%, a difference of 0.35%), and Immigrants from Uruguay (2.2%, a difference of 0.43%).
| Demographics | Rating | Rank | Vision Disability |
| Samoans | 15.7 /100 | #205 | Poor 2.2% |
| Pennsylvania Germans | 14.5 /100 | #206 | Poor 2.2% |
| Immigrants | Nigeria | 13.5 /100 | #207 | Poor 2.2% |
| Germans | 13.4 /100 | #208 | Poor 2.2% |
| Immigrants | Brazil | 13.1 /100 | #209 | Poor 2.2% |
| Immigrants | Uruguay | 11.5 /100 | #210 | Poor 2.2% |
| Indonesians | 9.5 /100 | #211 | Tragic 2.2% |
| Bermudans | 9.0 /100 | #212 | Tragic 2.2% |
| Immigrants | Ghana | 8.9 /100 | #213 | Tragic 2.2% |
| Trinidadians and Tobagonians | 8.2 /100 | #214 | Tragic 2.2% |
| Nigerians | 7.2 /100 | #215 | Tragic 2.3% |
| Immigrants | Trinidad and Tobago | 6.1 /100 | #216 | Tragic 2.3% |
| Barbadians | 5.1 /100 | #217 | Tragic 2.3% |
| Portuguese | 4.9 /100 | #218 | Tragic 2.3% |
| Ecuadorians | 4.6 /100 | #219 | Tragic 2.3% |
Demographics Similar to Marshallese by Vision Disability
In terms of vision disability, the demographic groups most similar to Marshallese are Scottish (2.3%, a difference of 0.070%), Immigrants from Congo (2.3%, a difference of 0.090%), Immigrants from Portugal (2.3%, a difference of 0.14%), Central American (2.3%, a difference of 0.25%), and German Russian (2.3%, a difference of 0.27%).
| Demographics | Rating | Rank | Vision Disability |
| Hmong | 2.5 /100 | #228 | Tragic 2.3% |
| Welsh | 2.3 /100 | #229 | Tragic 2.3% |
| Nicaraguans | 2.2 /100 | #230 | Tragic 2.3% |
| Immigrants | Ecuador | 2.0 /100 | #231 | Tragic 2.3% |
| German Russians | 1.8 /100 | #232 | Tragic 2.3% |
| Central Americans | 1.8 /100 | #233 | Tragic 2.3% |
| Scottish | 1.6 /100 | #234 | Tragic 2.3% |
| Marshallese | 1.5 /100 | #235 | Tragic 2.3% |
| Immigrants | Congo | 1.4 /100 | #236 | Tragic 2.3% |
| Immigrants | Portugal | 1.4 /100 | #237 | Tragic 2.3% |
| Immigrants | Cambodia | 1.1 /100 | #238 | Tragic 2.3% |
| English | 1.1 /100 | #239 | Tragic 2.3% |
| Panamanians | 0.9 /100 | #240 | Tragic 2.3% |
| Malaysians | 0.9 /100 | #241 | Tragic 2.3% |
| Immigrants | Panama | 0.8 /100 | #242 | Tragic 2.3% |