Bermudan vs Ute Vision Disability
COMPARE
Bermudan
Ute
Vision Disability
Vision Disability Comparison
Bermudans
Ute
2.2%
VISION DISABILITY
9.0/ 100
METRIC RATING
212th/ 347
METRIC RANK
2.4%
VISION DISABILITY
0.1/ 100
METRIC RATING
267th/ 347
METRIC RANK
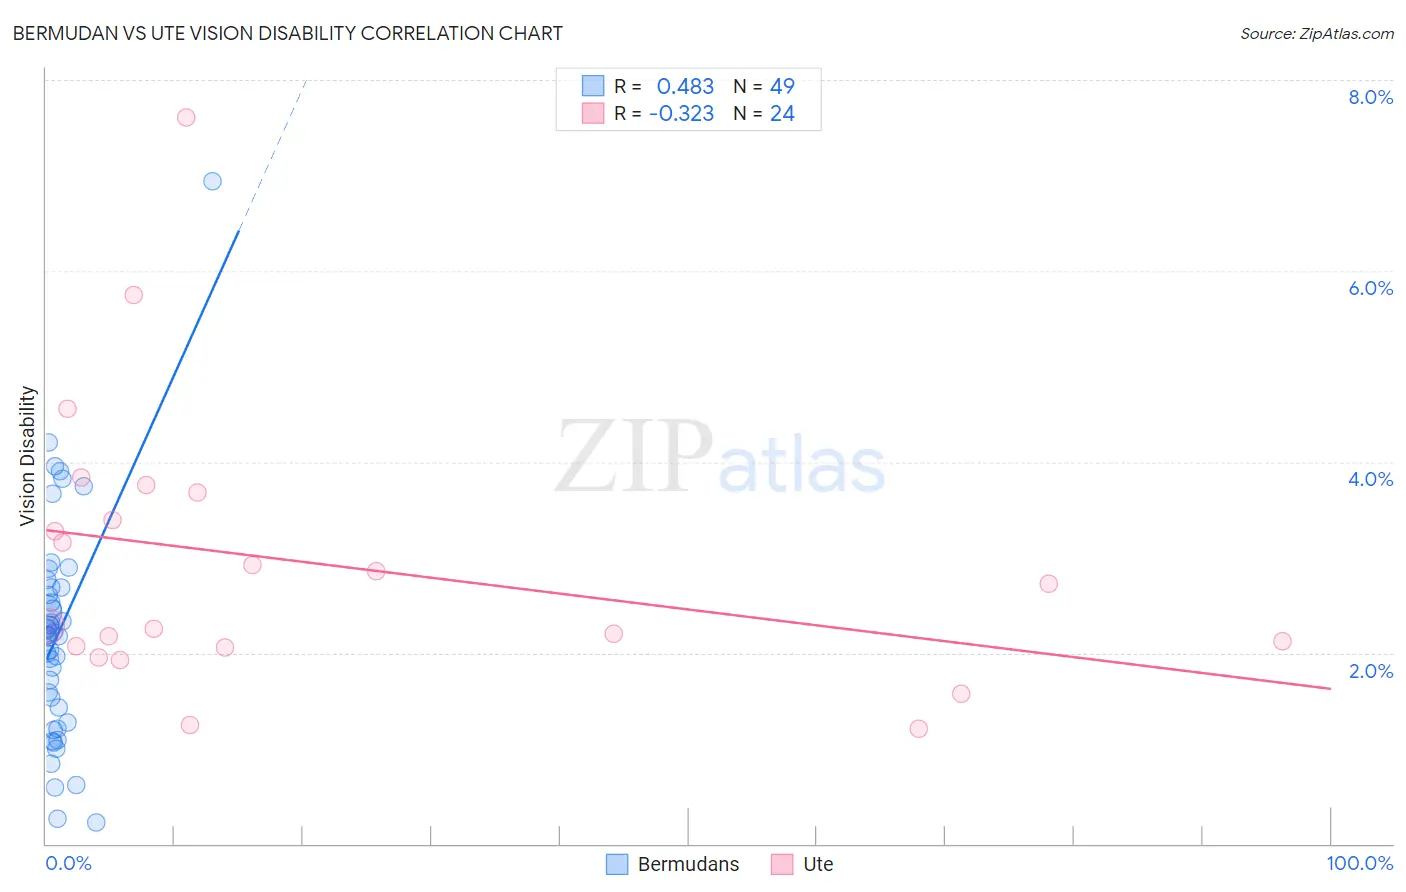
Bermudan vs Ute Vision Disability Correlation Chart
The statistical analysis conducted on geographies consisting of 55,718,331 people shows a moderate positive correlation between the proportion of Bermudans and percentage of population with vision disability in the United States with a correlation coefficient (R) of 0.483 and weighted average of 2.2%. Similarly, the statistical analysis conducted on geographies consisting of 55,653,653 people shows a mild negative correlation between the proportion of Ute and percentage of population with vision disability in the United States with a correlation coefficient (R) of -0.323 and weighted average of 2.4%, a difference of 6.9%.
Vision Disability Correlation Summary
| Measurement | Bermudan | Ute |
| Minimum | 0.22% | 1.2% |
| Maximum | 6.9% | 7.6% |
| Range | 6.7% | 6.4% |
| Mean | 2.2% | 2.9% |
| Median | 2.2% | 2.5% |
| Interquartile 25% (IQ1) | 1.3% | 2.1% |
| Interquartile 75% (IQ3) | 2.7% | 3.5% |
| Interquartile Range (IQR) | 1.3% | 1.5% |
| Standard Deviation (Sample) | 1.2% | 1.5% |
| Standard Deviation (Population) | 1.2% | 1.4% |
Similar Demographics by Vision Disability
Demographics Similar to Bermudans by Vision Disability
In terms of vision disability, the demographic groups most similar to Bermudans are Immigrants from Ghana (2.2%, a difference of 0.010%), Indonesian (2.2%, a difference of 0.090%), Trinidadian and Tobagonian (2.2%, a difference of 0.14%), Nigerian (2.3%, a difference of 0.35%), and Immigrants from Uruguay (2.2%, a difference of 0.43%).
| Demographics | Rating | Rank | Vision Disability |
| Samoans | 15.7 /100 | #205 | Poor 2.2% |
| Pennsylvania Germans | 14.5 /100 | #206 | Poor 2.2% |
| Immigrants | Nigeria | 13.5 /100 | #207 | Poor 2.2% |
| Germans | 13.4 /100 | #208 | Poor 2.2% |
| Immigrants | Brazil | 13.1 /100 | #209 | Poor 2.2% |
| Immigrants | Uruguay | 11.5 /100 | #210 | Poor 2.2% |
| Indonesians | 9.5 /100 | #211 | Tragic 2.2% |
| Bermudans | 9.0 /100 | #212 | Tragic 2.2% |
| Immigrants | Ghana | 8.9 /100 | #213 | Tragic 2.2% |
| Trinidadians and Tobagonians | 8.2 /100 | #214 | Tragic 2.2% |
| Nigerians | 7.2 /100 | #215 | Tragic 2.3% |
| Immigrants | Trinidad and Tobago | 6.1 /100 | #216 | Tragic 2.3% |
| Barbadians | 5.1 /100 | #217 | Tragic 2.3% |
| Portuguese | 4.9 /100 | #218 | Tragic 2.3% |
| Ecuadorians | 4.6 /100 | #219 | Tragic 2.3% |
Demographics Similar to Ute by Vision Disability
In terms of vision disability, the demographic groups most similar to Ute are Mexican American Indian (2.4%, a difference of 0.010%), Immigrants from Jamaica (2.4%, a difference of 0.050%), Immigrants from Liberia (2.4%, a difference of 0.080%), Senegalese (2.4%, a difference of 0.090%), and Immigrants from Belize (2.4%, a difference of 0.20%).
| Demographics | Rating | Rank | Vision Disability |
| Belizeans | 0.2 /100 | #260 | Tragic 2.4% |
| Fijians | 0.1 /100 | #261 | Tragic 2.4% |
| Jamaicans | 0.1 /100 | #262 | Tragic 2.4% |
| Immigrants | Belize | 0.1 /100 | #263 | Tragic 2.4% |
| Immigrants | Liberia | 0.1 /100 | #264 | Tragic 2.4% |
| Immigrants | Jamaica | 0.1 /100 | #265 | Tragic 2.4% |
| Mexican American Indians | 0.1 /100 | #266 | Tragic 2.4% |
| Ute | 0.1 /100 | #267 | Tragic 2.4% |
| Senegalese | 0.1 /100 | #268 | Tragic 2.4% |
| Celtics | 0.1 /100 | #269 | Tragic 2.4% |
| Cubans | 0.1 /100 | #270 | Tragic 2.4% |
| Immigrants | Azores | 0.1 /100 | #271 | Tragic 2.4% |
| Spaniards | 0.1 /100 | #272 | Tragic 2.4% |
| Immigrants | Bahamas | 0.1 /100 | #273 | Tragic 2.4% |
| Immigrants | Latin America | 0.0 /100 | #274 | Tragic 2.4% |