Bermudan vs Burmese Disability
COMPARE
Bermudan
Burmese
Disability
Disability Comparison
Bermudans
Burmese
12.3%
DISABILITY
1.1/ 100
METRIC RATING
252nd/ 347
METRIC RANK
10.4%
DISABILITY
100.0/ 100
METRIC RATING
18th/ 347
METRIC RANK
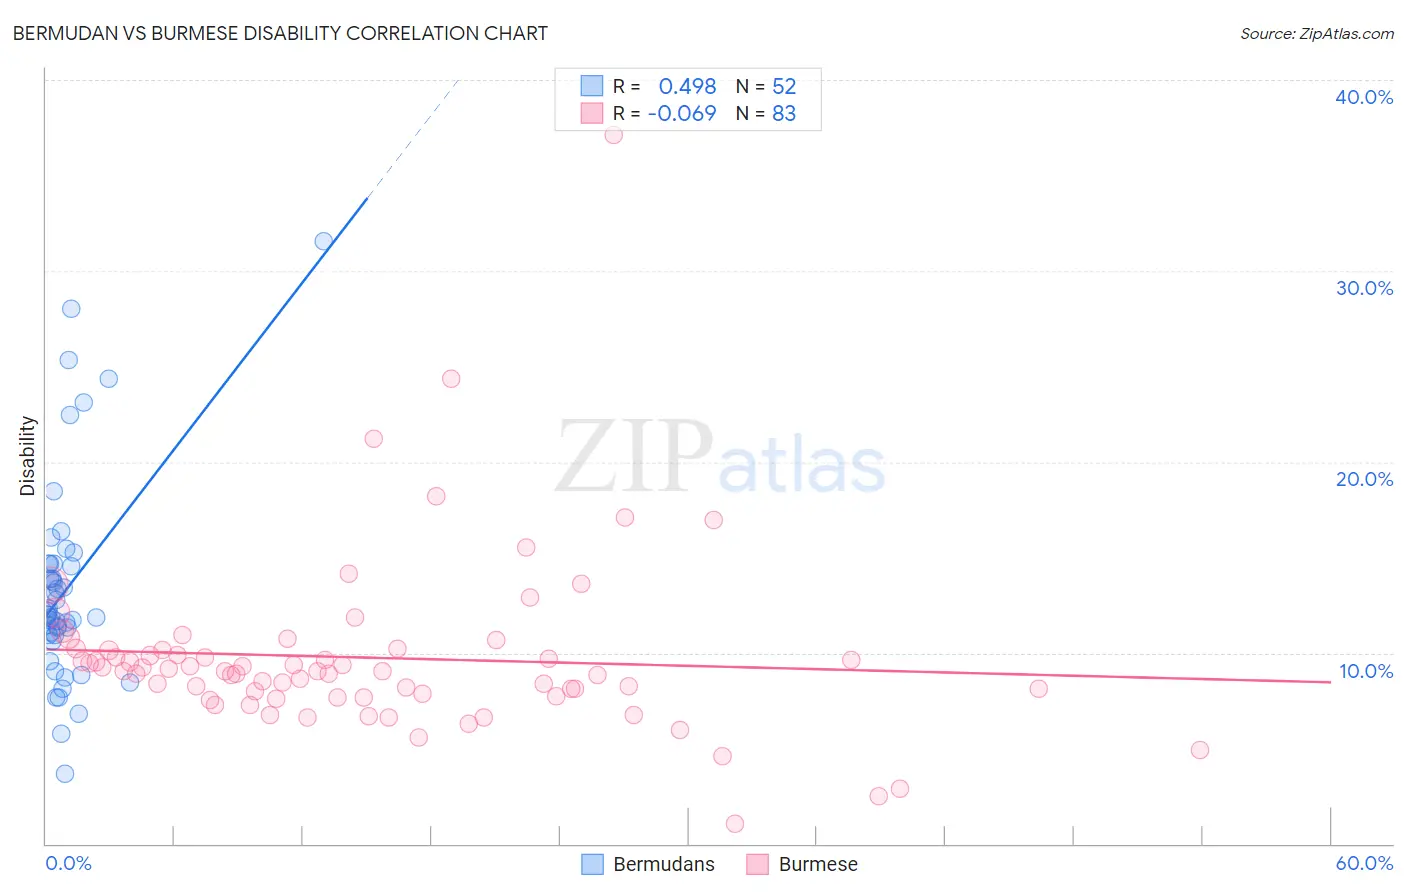
Bermudan vs Burmese Disability Correlation Chart
The statistical analysis conducted on geographies consisting of 55,721,549 people shows a moderate positive correlation between the proportion of Bermudans and percentage of population with a disability in the United States with a correlation coefficient (R) of 0.498 and weighted average of 12.3%. Similarly, the statistical analysis conducted on geographies consisting of 465,330,582 people shows a slight negative correlation between the proportion of Burmese and percentage of population with a disability in the United States with a correlation coefficient (R) of -0.069 and weighted average of 10.4%, a difference of 18.4%.
Disability Correlation Summary
| Measurement | Bermudan | Burmese |
| Minimum | 3.7% | 1.1% |
| Maximum | 31.6% | 37.1% |
| Range | 27.9% | 36.1% |
| Mean | 13.4% | 9.7% |
| Median | 12.0% | 9.0% |
| Interquartile 25% (IQ1) | 10.9% | 7.7% |
| Interquartile 75% (IQ3) | 14.7% | 10.2% |
| Interquartile Range (IQR) | 3.7% | 2.4% |
| Standard Deviation (Sample) | 5.4% | 4.7% |
| Standard Deviation (Population) | 5.4% | 4.6% |
Similar Demographics by Disability
Demographics Similar to Bermudans by Disability
In terms of disability, the demographic groups most similar to Bermudans are Subsaharan African (12.3%, a difference of 0.19%), European (12.3%, a difference of 0.19%), Carpatho Rusyn (12.3%, a difference of 0.20%), Guamanian/Chamorro (12.3%, a difference of 0.21%), and Indonesian (12.2%, a difference of 0.25%).
| Demographics | Rating | Rank | Disability |
| Liberians | 1.5 /100 | #245 | Tragic 12.2% |
| Swiss | 1.5 /100 | #246 | Tragic 12.2% |
| Indonesians | 1.4 /100 | #247 | Tragic 12.2% |
| Guamanians/Chamorros | 1.4 /100 | #248 | Tragic 12.3% |
| Carpatho Rusyns | 1.4 /100 | #249 | Tragic 12.3% |
| Sub-Saharan Africans | 1.4 /100 | #250 | Tragic 12.3% |
| Europeans | 1.4 /100 | #251 | Tragic 12.3% |
| Bermudans | 1.1 /100 | #252 | Tragic 12.3% |
| Belgians | 0.8 /100 | #253 | Tragic 12.3% |
| German Russians | 0.8 /100 | #254 | Tragic 12.3% |
| Slovenes | 0.6 /100 | #255 | Tragic 12.4% |
| Immigrants | Dominica | 0.6 /100 | #256 | Tragic 12.4% |
| Immigrants | Laos | 0.5 /100 | #257 | Tragic 12.4% |
| Slavs | 0.5 /100 | #258 | Tragic 12.4% |
| Canadians | 0.4 /100 | #259 | Tragic 12.4% |
Demographics Similar to Burmese by Disability
In terms of disability, the demographic groups most similar to Burmese are Immigrants from Pakistan (10.4%, a difference of 0.010%), Immigrants from Venezuela (10.4%, a difference of 0.70%), Asian (10.4%, a difference of 0.72%), Immigrants from Sri Lanka (10.5%, a difference of 0.83%), and Immigrants from Iran (10.3%, a difference of 0.99%).
| Demographics | Rating | Rank | Disability |
| Iranians | 100.0 /100 | #11 | Exceptional 10.1% |
| Immigrants | Israel | 100.0 /100 | #12 | Exceptional 10.1% |
| Immigrants | Eastern Asia | 100.0 /100 | #13 | Exceptional 10.2% |
| Immigrants | Korea | 100.0 /100 | #14 | Exceptional 10.2% |
| Okinawans | 100.0 /100 | #15 | Exceptional 10.3% |
| Indians (Asian) | 100.0 /100 | #16 | Exceptional 10.3% |
| Immigrants | Iran | 100.0 /100 | #17 | Exceptional 10.3% |
| Burmese | 100.0 /100 | #18 | Exceptional 10.4% |
| Immigrants | Pakistan | 100.0 /100 | #19 | Exceptional 10.4% |
| Immigrants | Venezuela | 100.0 /100 | #20 | Exceptional 10.4% |
| Asians | 100.0 /100 | #21 | Exceptional 10.4% |
| Immigrants | Sri Lanka | 100.0 /100 | #22 | Exceptional 10.5% |
| Immigrants | Asia | 100.0 /100 | #23 | Exceptional 10.5% |
| Venezuelans | 100.0 /100 | #24 | Exceptional 10.5% |
| Immigrants | Malaysia | 100.0 /100 | #25 | Exceptional 10.6% |