Bermudan vs Arapaho Hearing Disability
COMPARE
Bermudan
Arapaho
Hearing Disability
Hearing Disability Comparison
Bermudans
Arapaho
2.9%
HEARING DISABILITY
83.8/ 100
METRIC RATING
139th/ 347
METRIC RANK
4.1%
HEARING DISABILITY
0.0/ 100
METRIC RATING
327th/ 347
METRIC RANK
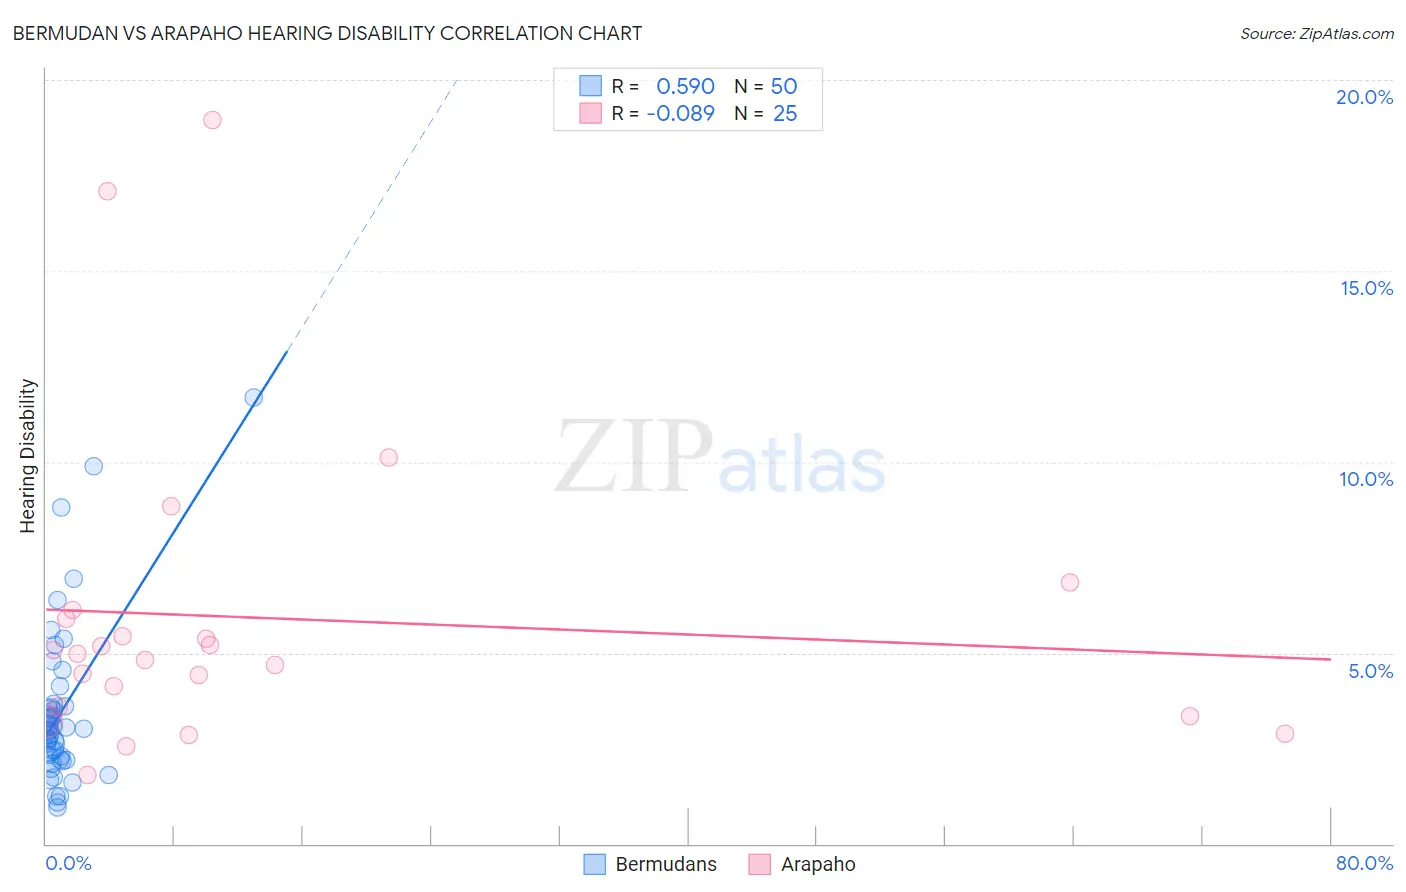
Bermudan vs Arapaho Hearing Disability Correlation Chart
The statistical analysis conducted on geographies consisting of 55,720,149 people shows a substantial positive correlation between the proportion of Bermudans and percentage of population with hearing disability in the United States with a correlation coefficient (R) of 0.590 and weighted average of 2.9%. Similarly, the statistical analysis conducted on geographies consisting of 29,771,465 people shows a slight negative correlation between the proportion of Arapaho and percentage of population with hearing disability in the United States with a correlation coefficient (R) of -0.089 and weighted average of 4.1%, a difference of 44.1%.
Hearing Disability Correlation Summary
| Measurement | Bermudan | Arapaho |
| Minimum | 0.95% | 1.8% |
| Maximum | 11.7% | 19.0% |
| Range | 10.7% | 17.2% |
| Mean | 3.5% | 5.9% |
| Median | 3.0% | 5.0% |
| Interquartile 25% (IQ1) | 2.2% | 3.5% |
| Interquartile 75% (IQ3) | 3.6% | 6.0% |
| Interquartile Range (IQR) | 1.4% | 2.5% |
| Standard Deviation (Sample) | 2.1% | 4.1% |
| Standard Deviation (Population) | 2.1% | 4.0% |
Similar Demographics by Hearing Disability
Demographics Similar to Bermudans by Hearing Disability
In terms of hearing disability, the demographic groups most similar to Bermudans are Immigrants from Jordan (2.9%, a difference of 0.020%), Sri Lankan (2.9%, a difference of 0.050%), Immigrants from Costa Rica (2.9%, a difference of 0.050%), Subsaharan African (2.9%, a difference of 0.090%), and Immigrants from Brazil (2.9%, a difference of 0.15%).
| Demographics | Rating | Rank | Hearing Disability |
| Chileans | 85.8 /100 | #132 | Excellent 2.9% |
| Immigrants | Syria | 85.8 /100 | #133 | Excellent 2.9% |
| Ugandans | 85.5 /100 | #134 | Excellent 2.9% |
| Soviet Union | 84.8 /100 | #135 | Excellent 2.9% |
| Immigrants | Brazil | 84.6 /100 | #136 | Excellent 2.9% |
| Sri Lankans | 84.1 /100 | #137 | Excellent 2.9% |
| Immigrants | Costa Rica | 84.0 /100 | #138 | Excellent 2.9% |
| Bermudans | 83.8 /100 | #139 | Excellent 2.9% |
| Immigrants | Jordan | 83.7 /100 | #140 | Excellent 2.9% |
| Sub-Saharan Africans | 83.3 /100 | #141 | Excellent 2.9% |
| Laotians | 81.1 /100 | #142 | Excellent 2.9% |
| Immigrants | Bahamas | 80.9 /100 | #143 | Excellent 2.9% |
| Immigrants | Bulgaria | 79.2 /100 | #144 | Good 2.9% |
| Immigrants | Congo | 78.9 /100 | #145 | Good 2.9% |
| Brazilians | 78.7 /100 | #146 | Good 2.9% |
Demographics Similar to Arapaho by Hearing Disability
In terms of hearing disability, the demographic groups most similar to Arapaho are Tohono O'odham (4.2%, a difference of 0.38%), Crow (4.2%, a difference of 0.39%), Potawatomi (4.1%, a difference of 0.72%), Lumbee (4.1%, a difference of 1.0%), and Native/Alaskan (4.2%, a difference of 1.2%).
| Demographics | Rating | Rank | Hearing Disability |
| Shoshone | 0.0 /100 | #320 | Tragic 4.0% |
| Paiute | 0.0 /100 | #321 | Tragic 4.1% |
| Seminole | 0.0 /100 | #322 | Tragic 4.1% |
| Apache | 0.0 /100 | #323 | Tragic 4.1% |
| Osage | 0.0 /100 | #324 | Tragic 4.1% |
| Lumbee | 0.0 /100 | #325 | Tragic 4.1% |
| Potawatomi | 0.0 /100 | #326 | Tragic 4.1% |
| Arapaho | 0.0 /100 | #327 | Tragic 4.1% |
| Tohono O'odham | 0.0 /100 | #328 | Tragic 4.2% |
| Crow | 0.0 /100 | #329 | Tragic 4.2% |
| Natives/Alaskans | 0.0 /100 | #330 | Tragic 4.2% |
| Cherokee | 0.0 /100 | #331 | Tragic 4.2% |
| Houma | 0.0 /100 | #332 | Tragic 4.2% |
| Dutch West Indians | 0.0 /100 | #333 | Tragic 4.3% |
| Aleuts | 0.0 /100 | #334 | Tragic 4.3% |