Bermudan vs French American Indian Hearing Disability
COMPARE
Bermudan
French American Indian
Hearing Disability
Hearing Disability Comparison
Bermudans
French American Indians
2.9%
HEARING DISABILITY
83.8/ 100
METRIC RATING
139th/ 347
METRIC RANK
3.6%
HEARING DISABILITY
0.0/ 100
METRIC RATING
280th/ 347
METRIC RANK
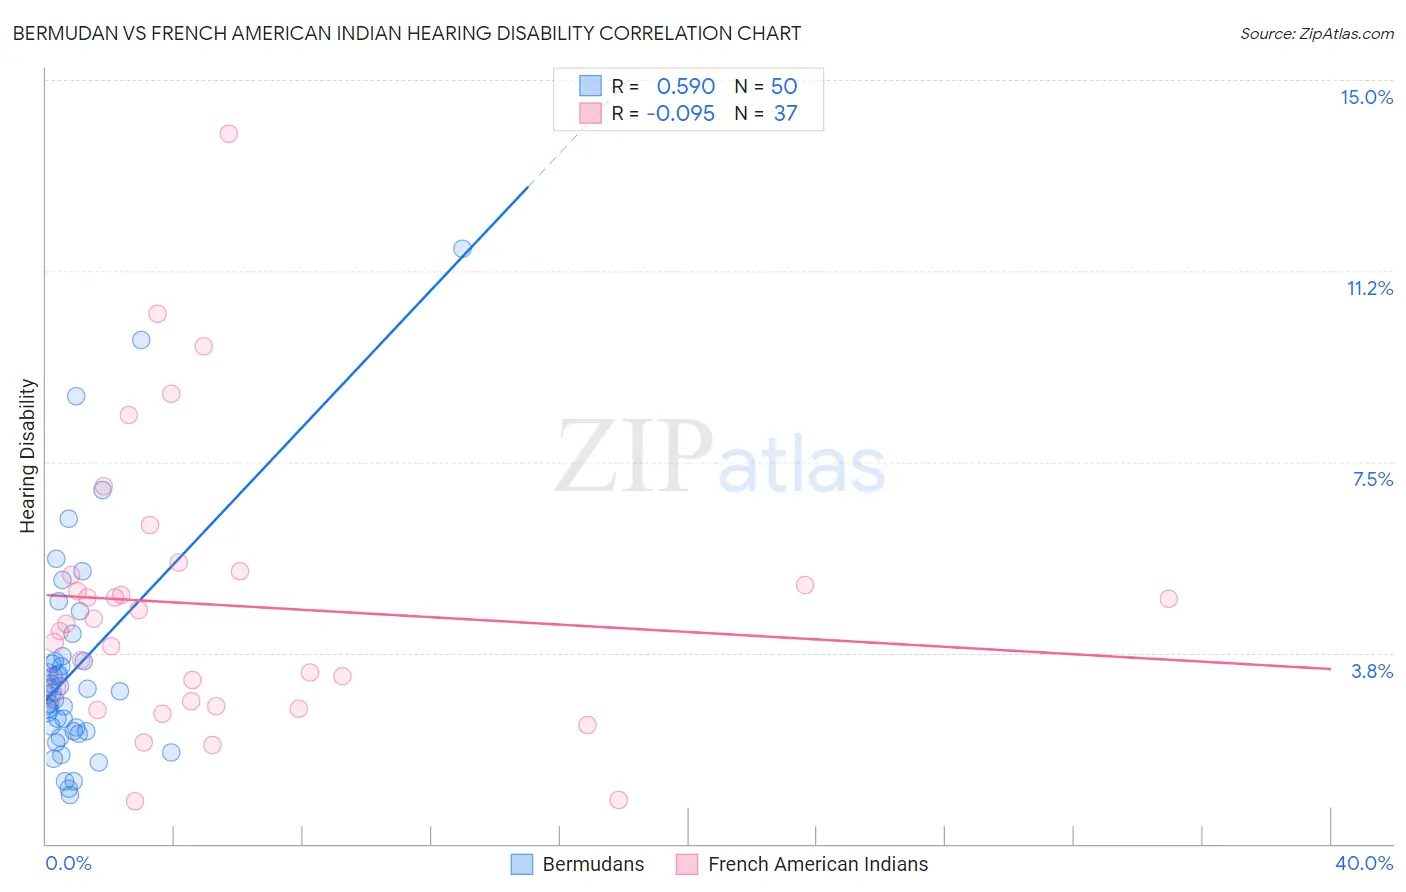
Bermudan vs French American Indian Hearing Disability Correlation Chart
The statistical analysis conducted on geographies consisting of 55,720,149 people shows a substantial positive correlation between the proportion of Bermudans and percentage of population with hearing disability in the United States with a correlation coefficient (R) of 0.590 and weighted average of 2.9%. Similarly, the statistical analysis conducted on geographies consisting of 131,957,139 people shows a slight negative correlation between the proportion of French American Indians and percentage of population with hearing disability in the United States with a correlation coefficient (R) of -0.095 and weighted average of 3.6%, a difference of 25.2%.
Hearing Disability Correlation Summary
| Measurement | Bermudan | French American Indian |
| Minimum | 0.95% | 0.83% |
| Maximum | 11.7% | 14.0% |
| Range | 10.7% | 13.1% |
| Mean | 3.5% | 4.7% |
| Median | 3.0% | 4.3% |
| Interquartile 25% (IQ1) | 2.2% | 2.8% |
| Interquartile 75% (IQ3) | 3.6% | 5.3% |
| Interquartile Range (IQR) | 1.4% | 2.6% |
| Standard Deviation (Sample) | 2.1% | 2.7% |
| Standard Deviation (Population) | 2.1% | 2.7% |
Similar Demographics by Hearing Disability
Demographics Similar to Bermudans by Hearing Disability
In terms of hearing disability, the demographic groups most similar to Bermudans are Immigrants from Jordan (2.9%, a difference of 0.020%), Sri Lankan (2.9%, a difference of 0.050%), Immigrants from Costa Rica (2.9%, a difference of 0.050%), Subsaharan African (2.9%, a difference of 0.090%), and Immigrants from Brazil (2.9%, a difference of 0.15%).
| Demographics | Rating | Rank | Hearing Disability |
| Chileans | 85.8 /100 | #132 | Excellent 2.9% |
| Immigrants | Syria | 85.8 /100 | #133 | Excellent 2.9% |
| Ugandans | 85.5 /100 | #134 | Excellent 2.9% |
| Soviet Union | 84.8 /100 | #135 | Excellent 2.9% |
| Immigrants | Brazil | 84.6 /100 | #136 | Excellent 2.9% |
| Sri Lankans | 84.1 /100 | #137 | Excellent 2.9% |
| Immigrants | Costa Rica | 84.0 /100 | #138 | Excellent 2.9% |
| Bermudans | 83.8 /100 | #139 | Excellent 2.9% |
| Immigrants | Jordan | 83.7 /100 | #140 | Excellent 2.9% |
| Sub-Saharan Africans | 83.3 /100 | #141 | Excellent 2.9% |
| Laotians | 81.1 /100 | #142 | Excellent 2.9% |
| Immigrants | Bahamas | 80.9 /100 | #143 | Excellent 2.9% |
| Immigrants | Bulgaria | 79.2 /100 | #144 | Good 2.9% |
| Immigrants | Congo | 78.9 /100 | #145 | Good 2.9% |
| Brazilians | 78.7 /100 | #146 | Good 2.9% |
Demographics Similar to French American Indians by Hearing Disability
In terms of hearing disability, the demographic groups most similar to French American Indians are Scandinavian (3.6%, a difference of 0.060%), Slovak (3.6%, a difference of 0.070%), Swedish (3.6%, a difference of 0.15%), Basque (3.6%, a difference of 0.33%), and Blackfeet (3.6%, a difference of 0.40%).
| Demographics | Rating | Rank | Hearing Disability |
| Puerto Ricans | 0.0 /100 | #273 | Tragic 3.5% |
| Swiss | 0.0 /100 | #274 | Tragic 3.5% |
| Czechoslovakians | 0.0 /100 | #275 | Tragic 3.6% |
| Danes | 0.0 /100 | #276 | Tragic 3.6% |
| Immigrants | Nonimmigrants | 0.0 /100 | #277 | Tragic 3.6% |
| Basques | 0.0 /100 | #278 | Tragic 3.6% |
| Slovaks | 0.0 /100 | #279 | Tragic 3.6% |
| French American Indians | 0.0 /100 | #280 | Tragic 3.6% |
| Scandinavians | 0.0 /100 | #281 | Tragic 3.6% |
| Swedes | 0.0 /100 | #282 | Tragic 3.6% |
| Blackfeet | 0.0 /100 | #283 | Tragic 3.6% |
| Immigrants | Micronesia | 0.0 /100 | #284 | Tragic 3.6% |
| Sioux | 0.0 /100 | #285 | Tragic 3.6% |
| Delaware | 0.0 /100 | #286 | Tragic 3.6% |
| Spanish | 0.0 /100 | #287 | Tragic 3.7% |