Bermudan vs Arapaho 12th Grade, No Diploma

COMPARE

Bermudan
Race
Ancestry
AfghanAfricanAlaska NativeAlaskan AthabascanAlbanianAleutAlsatianAmericanApacheArabArgentineanArmenianAssyrian/Chaldean/SyriacAustralianAustrianBahamianBangladeshiBarbadianBasqueBelgianBelizeanBermudanBhutaneseBlackfeetBolivianBrazilianBritishBritish West IndianBulgarianBurmeseCajunCambodianCanadianCape VerdeanCarpatho RusynCelticCentral AmericanCentral American IndianCherokeeCheyenneChickasawChileanChineseChippewaChoctawColombianColvilleComancheCosta RicanCreeCreekCroatianCrowCubanCypriotCzechCzechoslovakianDanishDelawareDominicanDutchDutch West IndianEastern EuropeanEcuadorianEgyptianEnglishEstonianEthiopianEuropeanFijianFilipinoFinnishFrenchFrench American IndianFrench CanadianGermanGerman RussianGhanaianGreekGuamanian/ChamorroGuatemalanGuyaneseHaitianHmongHonduranHopiHoumaHungarianIcelanderIndian (Asian)IndonesianInupiatIranianIraqiIrishIroquoisIsraeliItalianJamaicanJapaneseJordanianKenyanKiowaKoreanLaotianLatvianLebaneseLiberianLithuanianLumbeeLuxembourgerMacedonianMalaysianMalteseMarshalleseMenomineeMexicanMexican American IndianMongolianMoroccanNative HawaiianNavajoNepaleseNew ZealanderNicaraguanNigerianNorthern EuropeanNorwegianOkinawanOsageOttawaPaiutePakistaniPalestinianPanamanianParaguayanPennsylvania GermanPeruvianPimaPolishPortuguesePotawatomiPuebloPuerto RicanPuget Sound SalishRomanianRussianSalvadoranSamoanScandinavianScotch-IrishScottishSeminoleSenegaleseSerbianShoshoneSierra LeoneanSiouxSlavicSlovakSloveneSomaliSouth AfricanSouth AmericanSouth American IndianSoviet UnionSpaniardSpanishSpanish AmericanSpanish American IndianSri LankanSubsaharan AfricanSudaneseSwedishSwissSyrianTaiwaneseThaiTlingit-HaidaTohono O'OdhamTonganTrinidadian and TobagonianTsimshianTurkishU.S. Virgin IslanderUgandanUkrainianUruguayanUteVenezuelanVietnameseWelshWest IndianYakamaYaquiYugoslavianYumanYup'ikZimbabwean
Immigration
NonimmigrantsImmigrantsAfghanistanAfricaAlbaniaArgentinaArmeniaAsiaAustraliaAustriaBahamasBangladeshBarbadosBelarusBelgiumBelizeBoliviaBosnia and HerzegovinaBrazilBulgariaBurma/MyanmarCabo VerdeCambodiaCameroonCanadaCaribbeanCentral AmericaChileChinaColombiaCongoCosta RicaCroatiaCubaCzechoslovakiaDenmarkDominicaDominican RepublicEastern AfricaEastern AsiaEastern EuropeEcuadorEgyptEl SalvadorEnglandEritreaEthiopiaEuropeFijiFranceGermanyGhanaGreeceGrenadaGuatemalaGuyanaHaitiHondurasHong KongHungaryIndiaIndonesiaIranIraqIrelandIsraelItalyJamaicaJapanJordanKazakhstanKenyaKoreaKuwaitLaosLatin AmericaLatviaLebanonLiberiaLithuaniaMalaysiaMexicoMicronesiaMiddle AfricaMoldovaMoroccoNepalNetherlandsNicaraguaNigeriaNorth AmericaNorth MacedoniaNorthern AfricaNorthern EuropeNorwayOceaniaPakistanPanamaPeruPhilippinesPolandPortugalRomaniaRussiaSaudi ArabiaScotlandSenegalSerbiaSierra LeoneSingaporeSomaliaSouth AfricaSouth AmericaSouth Central AsiaSouth Eastern AsiaSouthern EuropeSpainSri LankaSt. Vincent and the GrenadinesSudanSwedenSwitzerlandSyriaTaiwanThailandTrinidad and TobagoTurkeyUgandaUkraineUruguayUzbekistanVenezuelaVietnamWest IndiesWestern AfricaWestern AsiaWestern EuropeYemenZaireZimbabweAzores
Arapaho
Race
Ancestry
AfghanAfricanAlaska NativeAlaskan AthabascanAlbanianAleutAlsatianAmericanApacheArabArapahoArgentineanArmenianAssyrian/Chaldean/SyriacAustralianAustrianBahamianBangladeshiBarbadianBasqueBelgianBelizeanBhutaneseBlackfeetBolivianBrazilianBritishBritish West IndianBulgarianBurmeseCajunCambodianCanadianCape VerdeanCarpatho RusynCelticCentral AmericanCentral American IndianCherokeeCheyenneChickasawChileanChineseChippewaChoctawColombianColvilleComancheCosta RicanCreeCreekCroatianCrowCubanCypriotCzechCzechoslovakianDanishDelawareDominicanDutchDutch West IndianEastern EuropeanEcuadorianEgyptianEnglishEstonianEthiopianEuropeanFijianFilipinoFinnishFrenchFrench American IndianFrench CanadianGermanGerman RussianGhanaianGreekGuamanian/ChamorroGuatemalanGuyaneseHaitianHmongHonduranHopiHoumaHungarianIcelanderIndian (Asian)IndonesianInupiatIranianIraqiIrishIroquoisIsraeliItalianJamaicanJapaneseJordanianKenyanKiowaKoreanLaotianLatvianLebaneseLiberianLithuanianLumbeeLuxembourgerMacedonianMalaysianMalteseMarshalleseMenomineeMexicanMexican American IndianMongolianMoroccanNative HawaiianNavajoNepaleseNew ZealanderNicaraguanNigerianNorthern EuropeanNorwegianOkinawanOsageOttawaPaiutePakistaniPalestinianPanamanianParaguayanPennsylvania GermanPeruvianPimaPolishPortuguesePotawatomiPuebloPuerto RicanPuget Sound SalishRomanianRussianSalvadoranSamoanScandinavianScotch-IrishScottishSeminoleSenegaleseSerbianShoshoneSierra LeoneanSiouxSlavicSlovakSloveneSomaliSouth AfricanSouth AmericanSouth American IndianSoviet UnionSpaniardSpanishSpanish AmericanSpanish American IndianSri LankanSubsaharan AfricanSudaneseSwedishSwissSyrianTaiwaneseThaiTlingit-HaidaTohono O'OdhamTonganTrinidadian and TobagonianTsimshianTurkishU.S. Virgin IslanderUgandanUkrainianUruguayanUteVenezuelanVietnameseWelshWest IndianYakamaYaquiYugoslavianYumanYup'ikZimbabwean
Immigration
NonimmigrantsImmigrantsAfghanistanAfricaAlbaniaArgentinaArmeniaAsiaAustraliaAustriaBahamasBangladeshBarbadosBelarusBelgiumBelizeBoliviaBosnia and HerzegovinaBrazilBulgariaBurma/MyanmarCabo VerdeCambodiaCameroonCanadaCaribbeanCentral AmericaChileChinaColombiaCongoCosta RicaCroatiaCubaCzechoslovakiaDenmarkDominicaDominican RepublicEastern AfricaEastern AsiaEastern EuropeEcuadorEgyptEl SalvadorEnglandEritreaEthiopiaEuropeFijiFranceGermanyGhanaGreeceGrenadaGuatemalaGuyanaHaitiHondurasHong KongHungaryIndiaIndonesiaIranIraqIrelandIsraelItalyJamaicaJapanJordanKazakhstanKenyaKoreaKuwaitLaosLatin AmericaLatviaLebanonLiberiaLithuaniaMalaysiaMexicoMicronesiaMiddle AfricaMoldovaMoroccoNepalNetherlandsNicaraguaNigeriaNorth AmericaNorth MacedoniaNorthern AfricaNorthern EuropeNorwayOceaniaPakistanPanamaPeruPhilippinesPolandPortugalRomaniaRussiaSaudi ArabiaScotlandSenegalSerbiaSierra LeoneSingaporeSomaliaSouth AfricaSouth AmericaSouth Central AsiaSouth Eastern AsiaSouthern EuropeSpainSri LankaSt. Vincent and the GrenadinesSudanSwedenSwitzerlandSyriaTaiwanThailandTrinidad and TobagoTurkeyUgandaUkraineUruguayUzbekistanVenezuelaVietnamWest IndiesWestern AfricaWestern AsiaWestern EuropeYemenZaireZimbabweAzores
12th Grade, No Diploma
Income
Poverty
Unemployment
Labor Participation
Family Structure
Vehicle Availability
Education Level
Disability

12th Grade, No Diploma Comparison

Bermudans

Arapaho

Average
Tragic
91.2%
12TH GRADE, NO DIPLOMA
50.8/ 100
METRIC RATING
172nd/ 347
METRIC RANK
90.5%
12TH GRADE, NO DIPLOMA
7.7/ 100
METRIC RATING
215th/ 347
METRIC RANK

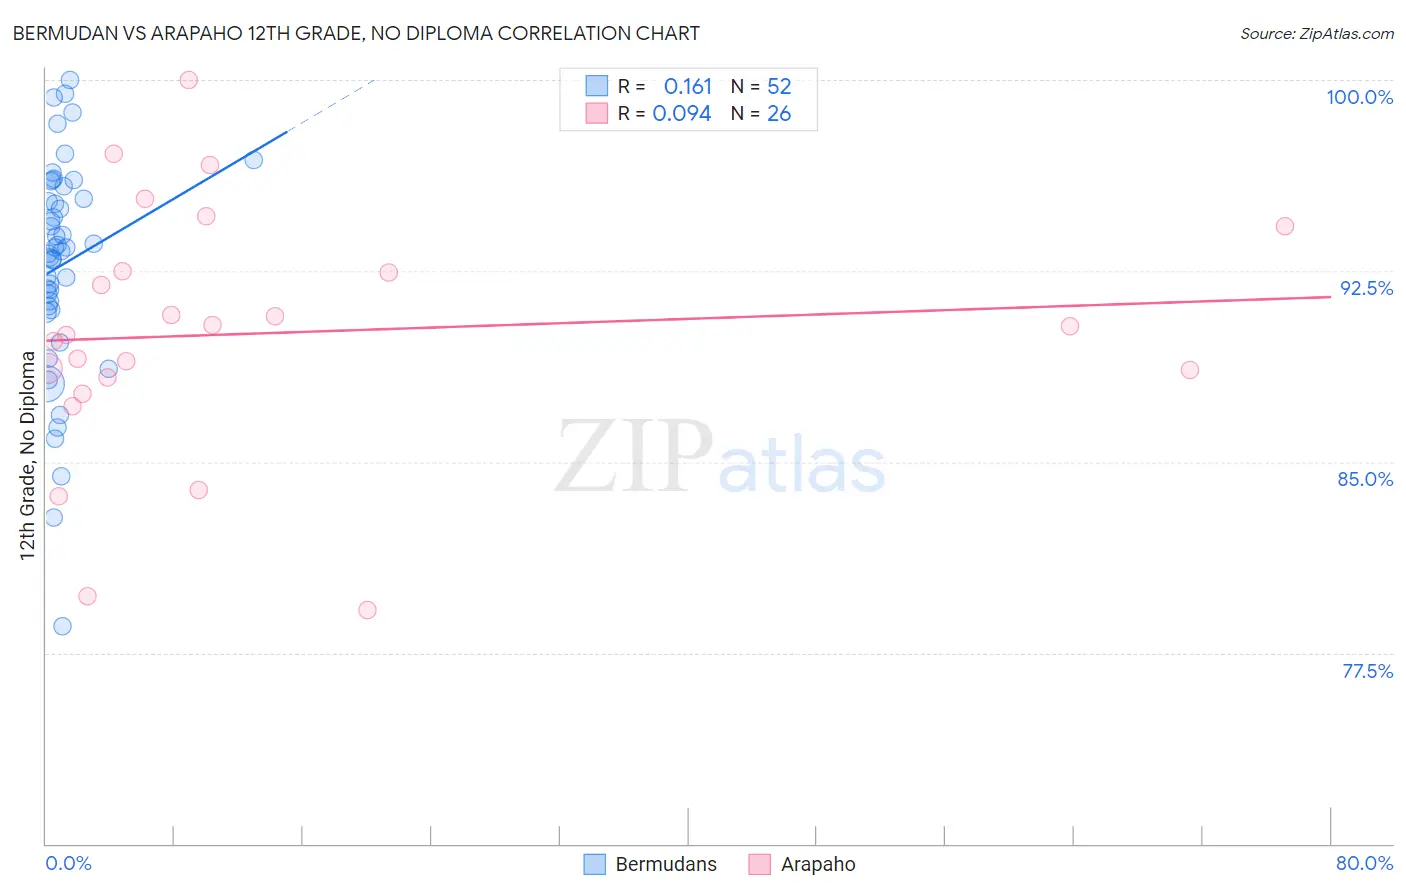
Bermudan vs Arapaho 12th Grade, No Diploma Correlation Chart

The statistical analysis conducted on geographies consisting of 55,730,379 people shows a poor positive correlation between the proportion of Bermudans and percentage of population with at least 12th grade (no diploma) education in the United States with a correlation coefficient (R) of 0.161 and weighted average of 91.2%. Similarly, the statistical analysis conducted on geographies consisting of 29,780,040 people shows a slight positive correlation between the proportion of Arapaho and percentage of population with at least 12th grade (no diploma) education in the United States with a correlation coefficient (R) of 0.094 and weighted average of 90.5%, a difference of 0.78%.
Bermudan vs Arapaho 12th Grade, No Diploma

12th Grade, No Diploma Correlation Summary

MeasurementBermudanArapaho
Minimum78.6%79.2%
Maximum100.0%100.0%
Range21.4%20.8%
Mean92.7%90.1%
Median93.4%90.2%
Interquartile 25% (IQ1)91.0%88.3%
Interquartile 75% (IQ3)95.6%92.5%
Interquartile Range (IQR)4.5%4.2%
Standard Deviation (Sample)4.3%4.9%
Standard Deviation (Population)4.2%4.8%

Similar Demographics by 12th Grade, No Diploma

Demographics Similar to Bermudans by 12th Grade, No Diploma

In terms of 12th grade, no diploma, the demographic groups most similar to Bermudans are Immigrants from Morocco (91.2%, a difference of 0.010%), Bolivian (91.2%, a difference of 0.010%), Immigrants from Nepal (91.2%, a difference of 0.010%), Delaware (91.2%, a difference of 0.020%), and Immigrants from Western Asia (91.2%, a difference of 0.020%).
DemographicsRating | Rank12th Grade, No Diploma
Alsatians
58.3
/100
|
#165
Average
91.3%
Hmong
58.0
/100
|
#166
Average
91.3%
Immigrants | Malaysia
57.8
/100
|
#167
Average
91.3%
Cree
57.0
/100
|
#168
Average
91.2%
Immigrants | Indonesia
54.9
/100
|
#169
Average
91.2%
Delaware
52.8
/100
|
#170
Average
91.2%
Immigrants | Morocco
51.4
/100
|
#171
Average
91.2%
Bermudans
50.8
/100
|
#172
Average
91.2%
Bolivians
50.4
/100
|
#173
Average
91.2%
Immigrants | Nepal
50.0
/100
|
#174
Average
91.2%
Immigrants | Western Asia
49.0
/100
|
#175
Average
91.2%
Iroquois
48.5
/100
|
#176
Average
91.1%
Sierra Leoneans
47.7
/100
|
#177
Average
91.1%
Spanish
43.7
/100
|
#178
Average
91.1%
Immigrants | Chile
43.3
/100
|
#179
Average
91.1%

Demographics Similar to Arapaho by 12th Grade, No Diploma

In terms of 12th grade, no diploma, the demographic groups most similar to Arapaho are Shoshone (90.5%, a difference of 0.010%), Cherokee (90.5%, a difference of 0.010%), Immigrants from Cameroon (90.5%, a difference of 0.010%), Immigrants from Africa (90.5%, a difference of 0.030%), and Uruguayan (90.4%, a difference of 0.030%).
DemographicsRating | Rank12th Grade, No Diploma
Immigrants | Micronesia
11.0
/100
|
#208
Poor
90.6%
Immigrants | Afghanistan
11.0
/100
|
#209
Poor
90.6%
South American Indians
10.9
/100
|
#210
Poor
90.6%
Portuguese
10.6
/100
|
#211
Poor
90.6%
Somalis
10.2
/100
|
#212
Poor
90.6%
Costa Ricans
9.4
/100
|
#213
Tragic
90.5%
Immigrants | Africa
8.5
/100
|
#214
Tragic
90.5%
Arapaho
7.7
/100
|
#215
Tragic
90.5%
Shoshone
7.5
/100
|
#216
Tragic
90.5%
Cherokee
7.4
/100
|
#217
Tragic
90.5%
Immigrants | Cameroon
7.4
/100
|
#218
Tragic
90.5%
Uruguayans
7.0
/100
|
#219
Tragic
90.4%
Colombians
6.6
/100
|
#220
Tragic
90.4%
Immigrants | Liberia
5.7
/100
|
#221
Tragic
90.4%
Immigrants | Somalia
5.3
/100
|
#222
Tragic
90.4%