Immigrants from Scotland vs Dutch West Indian Vision Disability
COMPARE
Immigrants from Scotland
Dutch West Indian
Vision Disability
Vision Disability Comparison
Immigrants from Scotland
Dutch West Indians
2.1%
VISION DISABILITY
90.4/ 100
METRIC RATING
121st/ 347
METRIC RANK
3.2%
VISION DISABILITY
0.0/ 100
METRIC RATING
337th/ 347
METRIC RANK
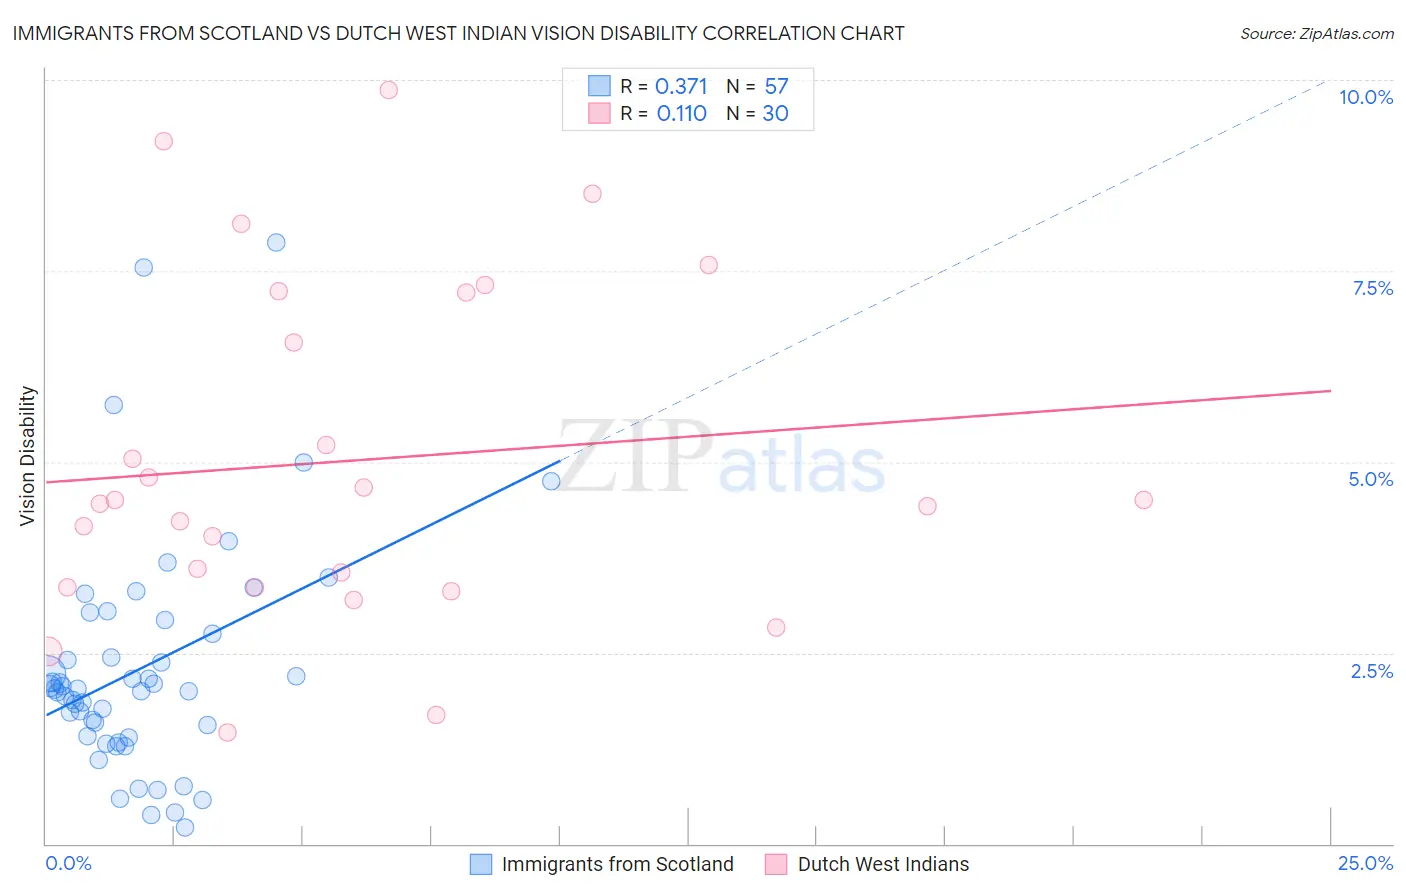
Immigrants from Scotland vs Dutch West Indian Vision Disability Correlation Chart
The statistical analysis conducted on geographies consisting of 196,324,297 people shows a mild positive correlation between the proportion of Immigrants from Scotland and percentage of population with vision disability in the United States with a correlation coefficient (R) of 0.371 and weighted average of 2.1%. Similarly, the statistical analysis conducted on geographies consisting of 85,756,307 people shows a poor positive correlation between the proportion of Dutch West Indians and percentage of population with vision disability in the United States with a correlation coefficient (R) of 0.110 and weighted average of 3.2%, a difference of 50.8%.
Vision Disability Correlation Summary
| Measurement | Immigrants from Scotland | Dutch West Indian |
| Minimum | 0.21% | 1.5% |
| Maximum | 7.9% | 9.9% |
| Range | 7.7% | 8.4% |
| Mean | 2.3% | 5.0% |
| Median | 2.0% | 4.5% |
| Interquartile 25% (IQ1) | 1.4% | 3.4% |
| Interquartile 75% (IQ3) | 2.8% | 7.2% |
| Interquartile Range (IQR) | 1.4% | 3.8% |
| Standard Deviation (Sample) | 1.5% | 2.2% |
| Standard Deviation (Population) | 1.5% | 2.2% |
Similar Demographics by Vision Disability
Demographics Similar to Immigrants from Scotland by Vision Disability
In terms of vision disability, the demographic groups most similar to Immigrants from Scotland are Immigrants from Ukraine (2.1%, a difference of 0.010%), Immigrants from Albania (2.1%, a difference of 0.010%), Immigrants from Spain (2.1%, a difference of 0.11%), Immigrants from Zimbabwe (2.1%, a difference of 0.12%), and Immigrants from Venezuela (2.1%, a difference of 0.12%).
| Demographics | Rating | Rank | Vision Disability |
| Croatians | 92.3 /100 | #114 | Exceptional 2.1% |
| Immigrants | Vietnam | 92.2 /100 | #115 | Exceptional 2.1% |
| Ugandans | 92.2 /100 | #116 | Exceptional 2.1% |
| Poles | 92.0 /100 | #117 | Exceptional 2.1% |
| Immigrants | Philippines | 91.4 /100 | #118 | Exceptional 2.1% |
| Immigrants | Uganda | 91.4 /100 | #119 | Exceptional 2.1% |
| Immigrants | Zimbabwe | 91.0 /100 | #120 | Exceptional 2.1% |
| Immigrants | Scotland | 90.4 /100 | #121 | Exceptional 2.1% |
| Immigrants | Ukraine | 90.4 /100 | #122 | Exceptional 2.1% |
| Immigrants | Albania | 90.4 /100 | #123 | Exceptional 2.1% |
| Immigrants | Spain | 89.8 /100 | #124 | Excellent 2.1% |
| Immigrants | Venezuela | 89.8 /100 | #125 | Excellent 2.1% |
| Immigrants | Peru | 89.5 /100 | #126 | Excellent 2.1% |
| Sudanese | 89.2 /100 | #127 | Excellent 2.1% |
| Immigrants | Chile | 89.0 /100 | #128 | Excellent 2.1% |
Demographics Similar to Dutch West Indians by Vision Disability
In terms of vision disability, the demographic groups most similar to Dutch West Indians are Alaskan Athabascan (3.1%, a difference of 0.030%), Navajo (3.1%, a difference of 0.19%), Chickasaw (3.2%, a difference of 0.91%), Tsimshian (3.2%, a difference of 1.6%), and Creek (3.2%, a difference of 1.7%).
| Demographics | Rating | Rank | Vision Disability |
| Colville | 0.0 /100 | #330 | Tragic 3.0% |
| Central American Indians | 0.0 /100 | #331 | Tragic 3.0% |
| Seminole | 0.0 /100 | #332 | Tragic 3.1% |
| Cajuns | 0.0 /100 | #333 | Tragic 3.1% |
| Cheyenne | 0.0 /100 | #334 | Tragic 3.1% |
| Navajo | 0.0 /100 | #335 | Tragic 3.1% |
| Alaskan Athabascans | 0.0 /100 | #336 | Tragic 3.1% |
| Dutch West Indians | 0.0 /100 | #337 | Tragic 3.2% |
| Chickasaw | 0.0 /100 | #338 | Tragic 3.2% |
| Tsimshian | 0.0 /100 | #339 | Tragic 3.2% |
| Creek | 0.0 /100 | #340 | Tragic 3.2% |
| Kiowa | 0.0 /100 | #341 | Tragic 3.3% |
| Choctaw | 0.0 /100 | #342 | Tragic 3.3% |
| Pima | 0.0 /100 | #343 | Tragic 3.3% |
| Pueblo | 0.0 /100 | #344 | Tragic 3.3% |