Belizean vs Dutch West Indian 12th Grade, No Diploma
COMPARE
Belizean
Dutch West Indian
12th Grade, No Diploma
12th Grade, No Diploma Comparison
Belizeans
Dutch West Indians
87.0%
12TH GRADE, NO DIPLOMA
0.0/ 100
METRIC RATING
318th/ 347
METRIC RANK
88.5%
12TH GRADE, NO DIPLOMA
0.0/ 100
METRIC RATING
289th/ 347
METRIC RANK
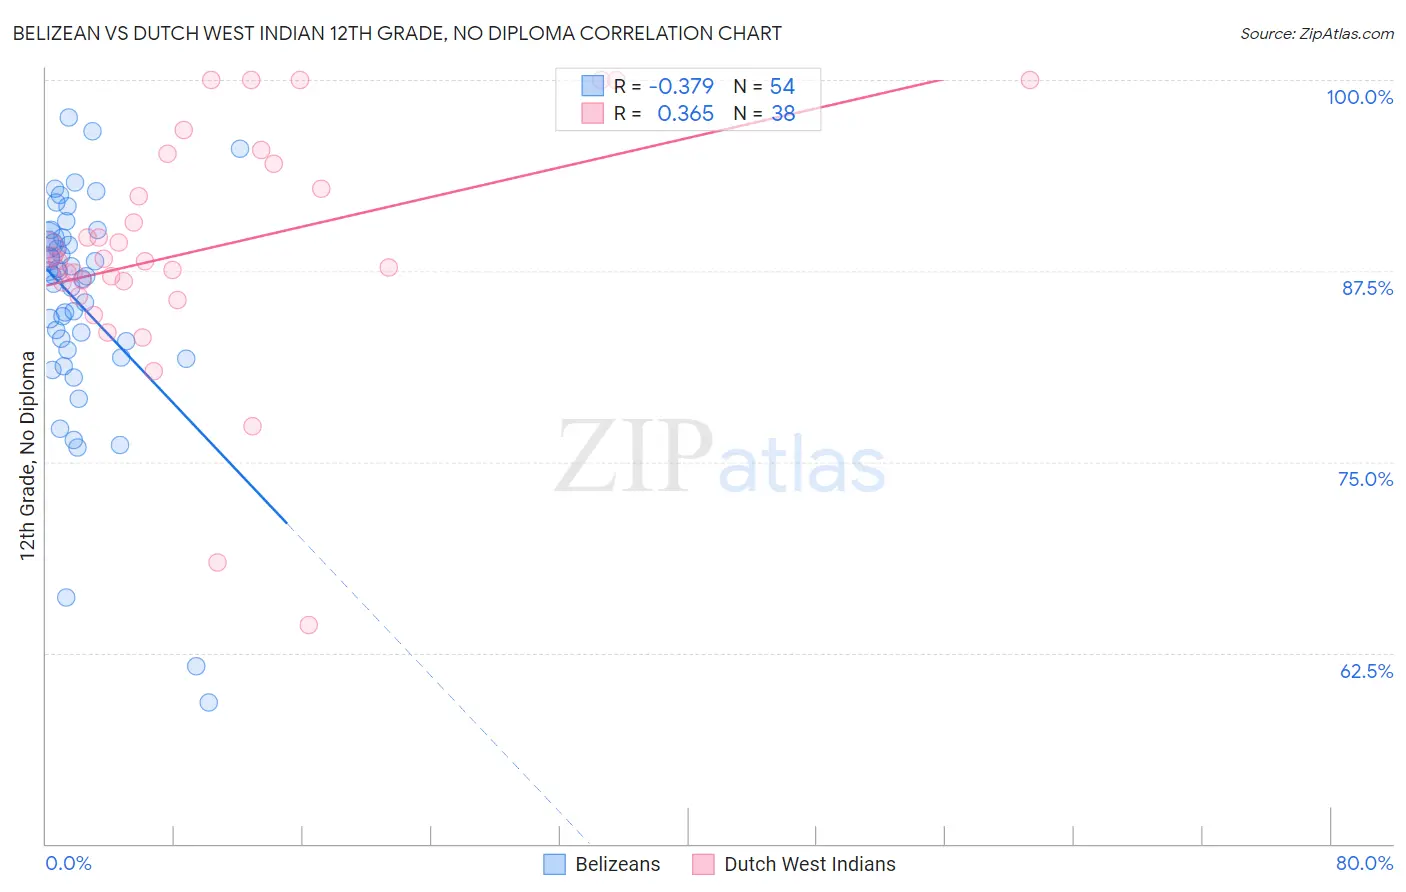
Belizean vs Dutch West Indian 12th Grade, No Diploma Correlation Chart
The statistical analysis conducted on geographies consisting of 144,225,006 people shows a mild negative correlation between the proportion of Belizeans and percentage of population with at least 12th grade (no diploma) education in the United States with a correlation coefficient (R) of -0.379 and weighted average of 87.0%. Similarly, the statistical analysis conducted on geographies consisting of 85,776,098 people shows a mild positive correlation between the proportion of Dutch West Indians and percentage of population with at least 12th grade (no diploma) education in the United States with a correlation coefficient (R) of 0.365 and weighted average of 88.5%, a difference of 1.8%.
12th Grade, No Diploma Correlation Summary
| Measurement | Belizean | Dutch West Indian |
| Minimum | 59.3% | 64.3% |
| Maximum | 97.5% | 100.0% |
| Range | 38.2% | 35.7% |
| Mean | 85.3% | 88.9% |
| Median | 87.2% | 88.2% |
| Interquartile 25% (IQ1) | 82.3% | 86.8% |
| Interquartile 75% (IQ3) | 89.5% | 94.5% |
| Interquartile Range (IQR) | 7.2% | 7.7% |
| Standard Deviation (Sample) | 7.5% | 7.9% |
| Standard Deviation (Population) | 7.5% | 7.8% |
Similar Demographics by 12th Grade, No Diploma
Demographics Similar to Belizeans by 12th Grade, No Diploma
In terms of 12th grade, no diploma, the demographic groups most similar to Belizeans are Navajo (87.1%, a difference of 0.060%), Immigrants from Belize (87.0%, a difference of 0.080%), Apache (87.3%, a difference of 0.35%), Nicaraguan (87.3%, a difference of 0.36%), and Cape Verdean (87.4%, a difference of 0.40%).
| Demographics | Rating | Rank | 12th Grade, No Diploma |
| Yaqui | 0.0 /100 | #311 | Tragic 87.5% |
| Immigrants | Ecuador | 0.0 /100 | #312 | Tragic 87.5% |
| Immigrants | Caribbean | 0.0 /100 | #313 | Tragic 87.4% |
| Cape Verdeans | 0.0 /100 | #314 | Tragic 87.4% |
| Nicaraguans | 0.0 /100 | #315 | Tragic 87.3% |
| Apache | 0.0 /100 | #316 | Tragic 87.3% |
| Navajo | 0.0 /100 | #317 | Tragic 87.1% |
| Belizeans | 0.0 /100 | #318 | Tragic 87.0% |
| Immigrants | Belize | 0.0 /100 | #319 | Tragic 87.0% |
| Immigrants | Nicaragua | 0.0 /100 | #320 | Tragic 86.6% |
| Puerto Ricans | 0.0 /100 | #321 | Tragic 86.5% |
| Central American Indians | 0.0 /100 | #322 | Tragic 86.5% |
| Yuman | 0.0 /100 | #323 | Tragic 86.5% |
| Immigrants | Cabo Verde | 0.0 /100 | #324 | Tragic 85.8% |
| Mexican American Indians | 0.0 /100 | #325 | Tragic 85.7% |
Demographics Similar to Dutch West Indians by 12th Grade, No Diploma
In terms of 12th grade, no diploma, the demographic groups most similar to Dutch West Indians are British West Indian (88.5%, a difference of 0.0%), Haitian (88.5%, a difference of 0.0%), Immigrants from Fiji (88.6%, a difference of 0.10%), Immigrants from West Indies (88.6%, a difference of 0.11%), and Hopi (88.6%, a difference of 0.11%).
| Demographics | Rating | Rank | 12th Grade, No Diploma |
| Immigrants | Vietnam | 0.0 /100 | #282 | Tragic 88.7% |
| Paiute | 0.0 /100 | #283 | Tragic 88.7% |
| Pennsylvania Germans | 0.0 /100 | #284 | Tragic 88.7% |
| Indonesians | 0.0 /100 | #285 | Tragic 88.6% |
| Immigrants | West Indies | 0.0 /100 | #286 | Tragic 88.6% |
| Hopi | 0.0 /100 | #287 | Tragic 88.6% |
| Immigrants | Fiji | 0.0 /100 | #288 | Tragic 88.6% |
| Dutch West Indians | 0.0 /100 | #289 | Tragic 88.5% |
| British West Indians | 0.0 /100 | #290 | Tragic 88.5% |
| Haitians | 0.0 /100 | #291 | Tragic 88.5% |
| Immigrants | Grenada | 0.0 /100 | #292 | Tragic 88.4% |
| Japanese | 0.0 /100 | #293 | Tragic 88.3% |
| Guyanese | 0.0 /100 | #294 | Tragic 88.3% |
| Immigrants | Immigrants | 0.0 /100 | #295 | Tragic 88.2% |
| Fijians | 0.0 /100 | #296 | Tragic 88.2% |