Belizean vs Immigrants from Eastern Europe Disability Age Under 5
COMPARE
Belizean
Immigrants from Eastern Europe
Disability Age Under 5
Disability Age Under 5 Comparison
Belizeans
Immigrants from Eastern Europe
1.2%
DISABILITY AGE UNDER 5
93.9/ 100
METRIC RATING
114th/ 347
METRIC RANK
1.2%
DISABILITY AGE UNDER 5
87.3/ 100
METRIC RATING
132nd/ 347
METRIC RANK
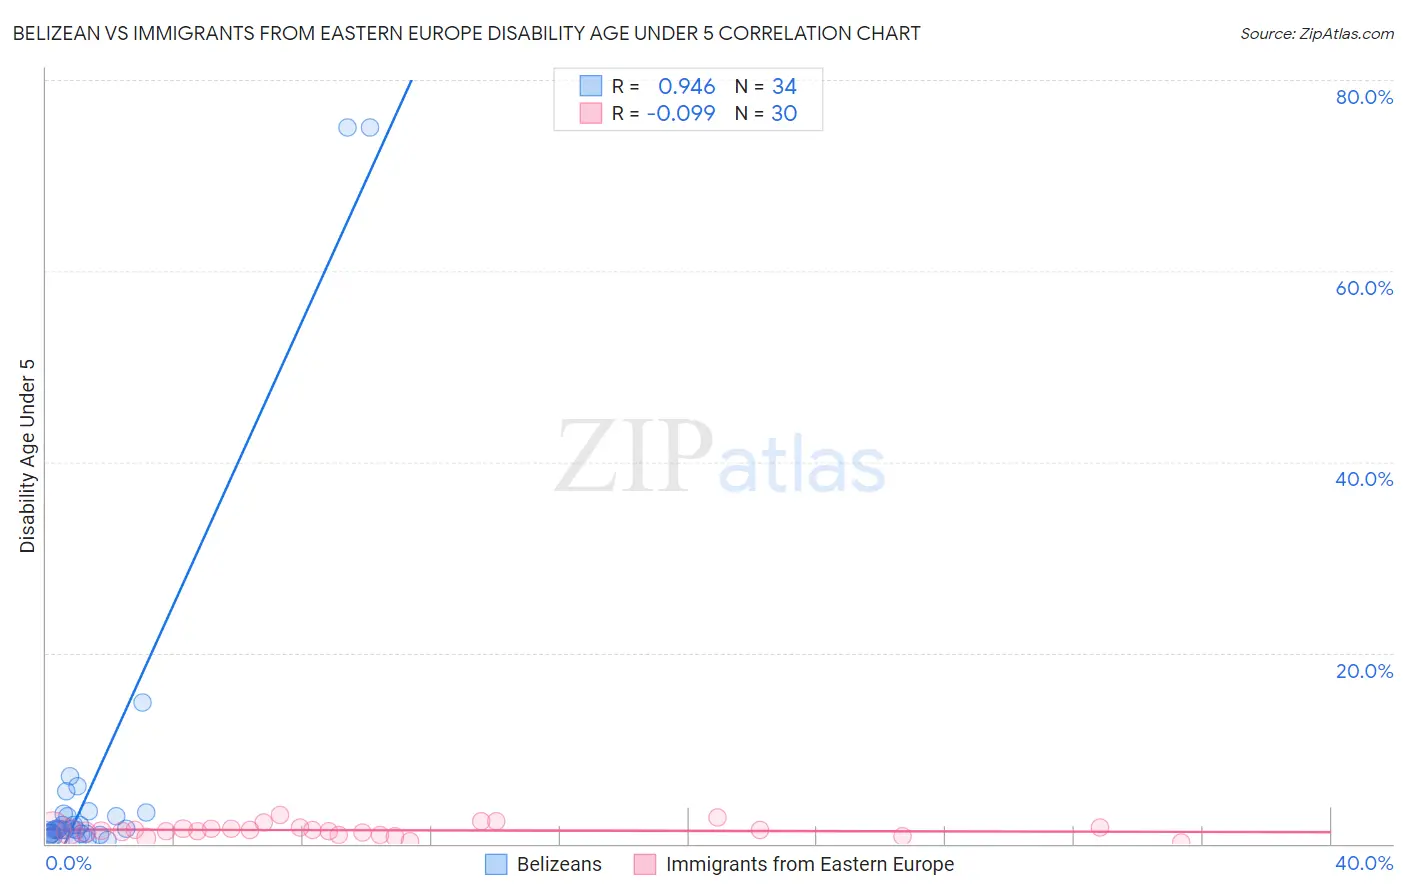
Belizean vs Immigrants from Eastern Europe Disability Age Under 5 Correlation Chart
The statistical analysis conducted on geographies consisting of 106,629,681 people shows a near-perfect positive correlation between the proportion of Belizeans and percentage of population with a disability under the age of 5 in the United States with a correlation coefficient (R) of 0.946 and weighted average of 1.2%. Similarly, the statistical analysis conducted on geographies consisting of 238,831,342 people shows a slight negative correlation between the proportion of Immigrants from Eastern Europe and percentage of population with a disability under the age of 5 in the United States with a correlation coefficient (R) of -0.099 and weighted average of 1.2%, a difference of 1.9%.
Disability Age Under 5 Correlation Summary
| Measurement | Belizean | Immigrants from Eastern Europe |
| Minimum | 0.27% | 0.14% |
| Maximum | 75.0% | 3.0% |
| Range | 74.7% | 2.8% |
| Mean | 6.7% | 1.4% |
| Median | 1.5% | 1.4% |
| Interquartile 25% (IQ1) | 1.0% | 1.1% |
| Interquartile 75% (IQ3) | 3.1% | 1.6% |
| Interquartile Range (IQR) | 2.1% | 0.47% |
| Standard Deviation (Sample) | 17.5% | 0.64% |
| Standard Deviation (Population) | 17.3% | 0.63% |
Demographics Similar to Belizeans and Immigrants from Eastern Europe by Disability Age Under 5
In terms of disability age under 5, the demographic groups most similar to Belizeans are Immigrants from Caribbean (1.2%, a difference of 0.010%), Immigrants from Northern Africa (1.2%, a difference of 0.030%), Immigrants from Oceania (1.2%, a difference of 0.15%), Immigrants from Philippines (1.2%, a difference of 0.17%), and Immigrants from Venezuela (1.2%, a difference of 0.20%). Similarly, the demographic groups most similar to Immigrants from Eastern Europe are Immigrants from Serbia (1.2%, a difference of 0.070%), Korean (1.2%, a difference of 0.090%), Immigrants (1.2%, a difference of 0.16%), Immigrants from Spain (1.2%, a difference of 0.16%), and Immigrants from France (1.2%, a difference of 0.25%).
| Demographics | Rating | Rank | Disability Age Under 5 |
| Immigrants | Oceania | 94.2 /100 | #113 | Exceptional 1.2% |
| Belizeans | 93.9 /100 | #114 | Exceptional 1.2% |
| Immigrants | Caribbean | 93.8 /100 | #115 | Exceptional 1.2% |
| Immigrants | Northern Africa | 93.8 /100 | #116 | Exceptional 1.2% |
| Immigrants | Philippines | 93.5 /100 | #117 | Exceptional 1.2% |
| Immigrants | Venezuela | 93.4 /100 | #118 | Exceptional 1.2% |
| Bhutanese | 92.5 /100 | #119 | Exceptional 1.2% |
| Immigrants | Eritrea | 92.3 /100 | #120 | Exceptional 1.2% |
| Immigrants | Senegal | 91.4 /100 | #121 | Exceptional 1.2% |
| Aleuts | 90.7 /100 | #122 | Exceptional 1.2% |
| Zimbabweans | 90.6 /100 | #123 | Exceptional 1.2% |
| Immigrants | Cambodia | 90.5 /100 | #124 | Exceptional 1.2% |
| Japanese | 90.3 /100 | #125 | Exceptional 1.2% |
| Central Americans | 89.7 /100 | #126 | Excellent 1.2% |
| Immigrants | Romania | 88.4 /100 | #127 | Excellent 1.2% |
| Immigrants | France | 88.4 /100 | #128 | Excellent 1.2% |
| Immigrants | Immigrants | 88.0 /100 | #129 | Excellent 1.2% |
| Koreans | 87.7 /100 | #130 | Excellent 1.2% |
| Immigrants | Serbia | 87.6 /100 | #131 | Excellent 1.2% |
| Immigrants | Eastern Europe | 87.3 /100 | #132 | Excellent 1.2% |
| Immigrants | Spain | 86.5 /100 | #133 | Excellent 1.2% |