Belgian vs Paiute Disability Age 18 to 34
COMPARE
Belgian
Paiute
Disability Age 18 to 34
Disability Age 18 to 34 Comparison
Belgians
Paiute
7.4%
DISABILITY AGE 18 TO 34
0.1/ 100
METRIC RATING
270th/ 347
METRIC RANK
7.5%
DISABILITY AGE 18 TO 34
0.0/ 100
METRIC RATING
281st/ 347
METRIC RANK
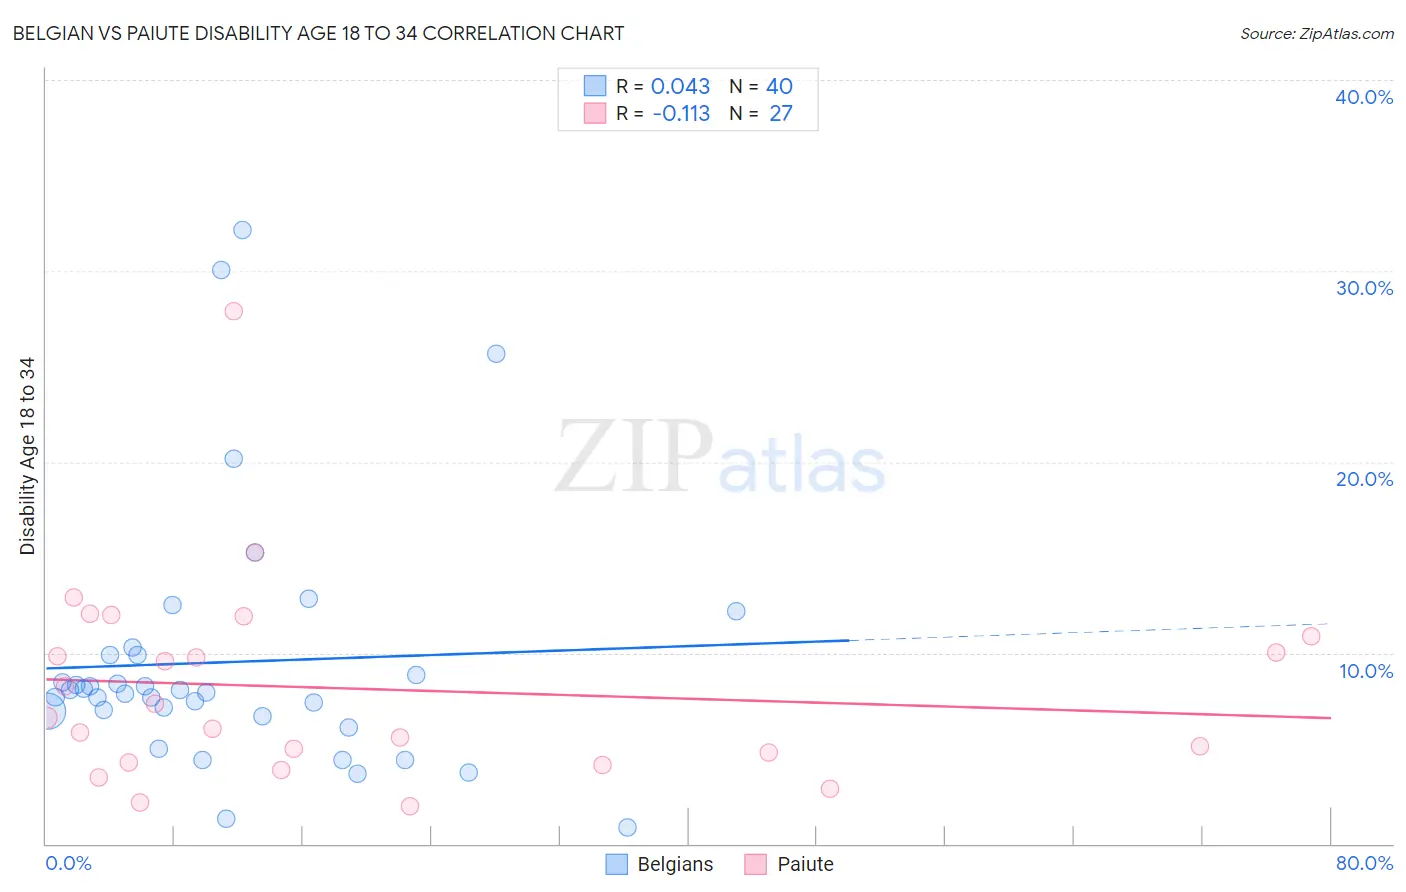
Belgian vs Paiute Disability Age 18 to 34 Correlation Chart
The statistical analysis conducted on geographies consisting of 355,052,647 people shows no correlation between the proportion of Belgians and percentage of population with a disability between the ages 18 and 35 in the United States with a correlation coefficient (R) of 0.043 and weighted average of 7.4%. Similarly, the statistical analysis conducted on geographies consisting of 58,354,708 people shows a poor negative correlation between the proportion of Paiute and percentage of population with a disability between the ages 18 and 35 in the United States with a correlation coefficient (R) of -0.113 and weighted average of 7.5%, a difference of 1.3%.
Disability Age 18 to 34 Correlation Summary
| Measurement | Belgian | Paiute |
| Minimum | 0.85% | 2.0% |
| Maximum | 32.1% | 27.9% |
| Range | 31.3% | 25.9% |
| Mean | 9.5% | 8.1% |
| Median | 8.0% | 6.6% |
| Interquartile 25% (IQ1) | 6.8% | 4.2% |
| Interquartile 75% (IQ3) | 9.9% | 10.9% |
| Interquartile Range (IQR) | 3.1% | 6.6% |
| Standard Deviation (Sample) | 6.7% | 5.4% |
| Standard Deviation (Population) | 6.6% | 5.3% |
Demographics Similar to Belgians and Paiute by Disability Age 18 to 34
In terms of disability age 18 to 34, the demographic groups most similar to Belgians are Swiss (7.4%, a difference of 0.050%), Basque (7.4%, a difference of 0.090%), Portuguese (7.4%, a difference of 0.13%), Tsimshian (7.4%, a difference of 0.14%), and Slavic (7.4%, a difference of 0.19%). Similarly, the demographic groups most similar to Paiute are Spanish (7.5%, a difference of 0.20%), Danish (7.5%, a difference of 0.30%), Hopi (7.5%, a difference of 0.44%), Yaqui (7.4%, a difference of 0.48%), and Czechoslovakian (7.4%, a difference of 0.49%).
| Demographics | Rating | Rank | Disability Age 18 to 34 |
| Slovenes | 0.1 /100 | #265 | Tragic 7.3% |
| German Russians | 0.1 /100 | #266 | Tragic 7.4% |
| Bangladeshis | 0.1 /100 | #267 | Tragic 7.4% |
| Portuguese | 0.1 /100 | #268 | Tragic 7.4% |
| Basques | 0.1 /100 | #269 | Tragic 7.4% |
| Belgians | 0.1 /100 | #270 | Tragic 7.4% |
| Swiss | 0.1 /100 | #271 | Tragic 7.4% |
| Tsimshian | 0.1 /100 | #272 | Tragic 7.4% |
| Slavs | 0.1 /100 | #273 | Tragic 7.4% |
| Africans | 0.1 /100 | #274 | Tragic 7.4% |
| Immigrants | Somalia | 0.1 /100 | #275 | Tragic 7.4% |
| Europeans | 0.1 /100 | #276 | Tragic 7.4% |
| Immigrants | Portugal | 0.1 /100 | #277 | Tragic 7.4% |
| Lumbee | 0.1 /100 | #278 | Tragic 7.4% |
| Czechoslovakians | 0.1 /100 | #279 | Tragic 7.4% |
| Yaqui | 0.1 /100 | #280 | Tragic 7.4% |
| Paiute | 0.0 /100 | #281 | Tragic 7.5% |
| Spanish | 0.0 /100 | #282 | Tragic 7.5% |
| Danes | 0.0 /100 | #283 | Tragic 7.5% |
| Hopi | 0.0 /100 | #284 | Tragic 7.5% |
| Swedes | 0.0 /100 | #285 | Tragic 7.5% |