Basque vs Laotian Cognitive Disability
COMPARE
Basque
Laotian
Cognitive Disability
Cognitive Disability Comparison
Basques
Laotians
17.1%
COGNITIVE DISABILITY
85.5/ 100
METRIC RATING
150th/ 347
METRIC RANK
17.3%
COGNITIVE DISABILITY
50.0/ 100
METRIC RATING
174th/ 347
METRIC RANK
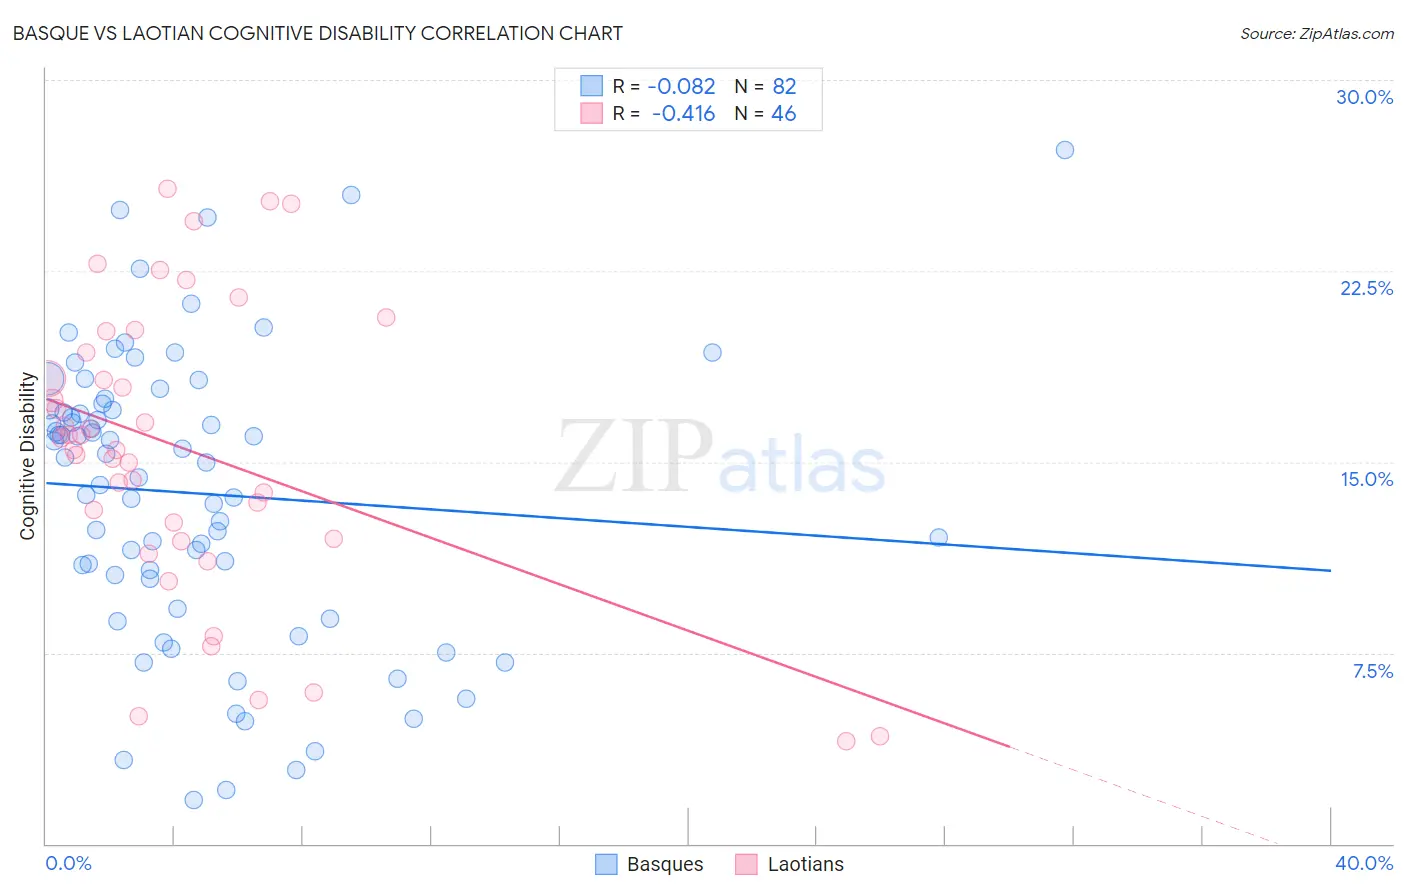
Basque vs Laotian Cognitive Disability Correlation Chart
The statistical analysis conducted on geographies consisting of 165,778,299 people shows a slight negative correlation between the proportion of Basques and percentage of population with cognitive disability in the United States with a correlation coefficient (R) of -0.082 and weighted average of 17.1%. Similarly, the statistical analysis conducted on geographies consisting of 224,855,635 people shows a moderate negative correlation between the proportion of Laotians and percentage of population with cognitive disability in the United States with a correlation coefficient (R) of -0.416 and weighted average of 17.3%, a difference of 1.3%.
Cognitive Disability Correlation Summary
| Measurement | Basque | Laotian |
| Minimum | 1.7% | 4.0% |
| Maximum | 27.3% | 25.7% |
| Range | 25.6% | 21.7% |
| Mean | 13.8% | 15.5% |
| Median | 15.1% | 15.7% |
| Interquartile 25% (IQ1) | 10.4% | 12.0% |
| Interquartile 75% (IQ3) | 17.1% | 19.3% |
| Interquartile Range (IQR) | 6.7% | 7.3% |
| Standard Deviation (Sample) | 5.7% | 5.7% |
| Standard Deviation (Population) | 5.6% | 5.6% |
Similar Demographics by Cognitive Disability
Demographics Similar to Basques by Cognitive Disability
In terms of cognitive disability, the demographic groups most similar to Basques are French Canadian (17.1%, a difference of 0.010%), Cypriot (17.1%, a difference of 0.010%), Scotch-Irish (17.1%, a difference of 0.030%), Syrian (17.1%, a difference of 0.13%), and Immigrants from Indonesia (17.1%, a difference of 0.15%).
| Demographics | Rating | Rank | Cognitive Disability |
| British | 89.3 /100 | #143 | Excellent 17.0% |
| Immigrants | Brazil | 89.3 /100 | #144 | Excellent 17.0% |
| Immigrants | South Eastern Asia | 88.7 /100 | #145 | Excellent 17.0% |
| Costa Ricans | 88.0 /100 | #146 | Excellent 17.0% |
| Scotch-Irish | 85.9 /100 | #147 | Excellent 17.1% |
| French Canadians | 85.7 /100 | #148 | Excellent 17.1% |
| Cypriots | 85.7 /100 | #149 | Excellent 17.1% |
| Basques | 85.5 /100 | #150 | Excellent 17.1% |
| Syrians | 83.0 /100 | #151 | Excellent 17.1% |
| Immigrants | Indonesia | 82.7 /100 | #152 | Excellent 17.1% |
| Immigrants | Kazakhstan | 80.5 /100 | #153 | Excellent 17.1% |
| Immigrants | Malaysia | 79.3 /100 | #154 | Good 17.1% |
| Brazilians | 78.9 /100 | #155 | Good 17.1% |
| Sri Lankans | 78.9 /100 | #156 | Good 17.1% |
| Immigrants | Australia | 76.0 /100 | #157 | Good 17.1% |
Demographics Similar to Laotians by Cognitive Disability
In terms of cognitive disability, the demographic groups most similar to Laotians are Immigrants from Northern Africa (17.3%, a difference of 0.010%), Tsimshian (17.3%, a difference of 0.010%), Shoshone (17.3%, a difference of 0.020%), Ute (17.3%, a difference of 0.030%), and Spanish (17.3%, a difference of 0.030%).
| Demographics | Rating | Rank | Cognitive Disability |
| Immigrants | Syria | 63.5 /100 | #167 | Good 17.2% |
| Immigrants | Immigrants | 62.5 /100 | #168 | Good 17.2% |
| Immigrants | Portugal | 61.8 /100 | #169 | Good 17.2% |
| Ecuadorians | 59.6 /100 | #170 | Average 17.2% |
| Tlingit-Haida | 59.4 /100 | #171 | Average 17.2% |
| Immigrants | Turkey | 56.7 /100 | #172 | Average 17.2% |
| Immigrants | Northern Africa | 50.2 /100 | #173 | Average 17.3% |
| Laotians | 50.0 /100 | #174 | Average 17.3% |
| Tsimshian | 49.8 /100 | #175 | Average 17.3% |
| Shoshone | 49.2 /100 | #176 | Average 17.3% |
| Ute | 49.1 /100 | #177 | Average 17.3% |
| Spanish | 48.9 /100 | #178 | Average 17.3% |
| Sioux | 48.6 /100 | #179 | Average 17.3% |
| Pakistanis | 43.9 /100 | #180 | Average 17.3% |
| Immigrants | Guyana | 42.9 /100 | #181 | Average 17.3% |