Immigrants from Yemen vs Trinidadian and Tobagonian Cognitive Disability
COMPARE
Immigrants from Yemen
Trinidadian and Tobagonian
Cognitive Disability
Cognitive Disability Comparison
Immigrants from Yemen
Trinidadians and Tobagonians
18.8%
COGNITIVE DISABILITY
0.0/ 100
METRIC RATING
333rd/ 347
METRIC RANK
17.9%
COGNITIVE DISABILITY
0.8/ 100
METRIC RATING
245th/ 347
METRIC RANK
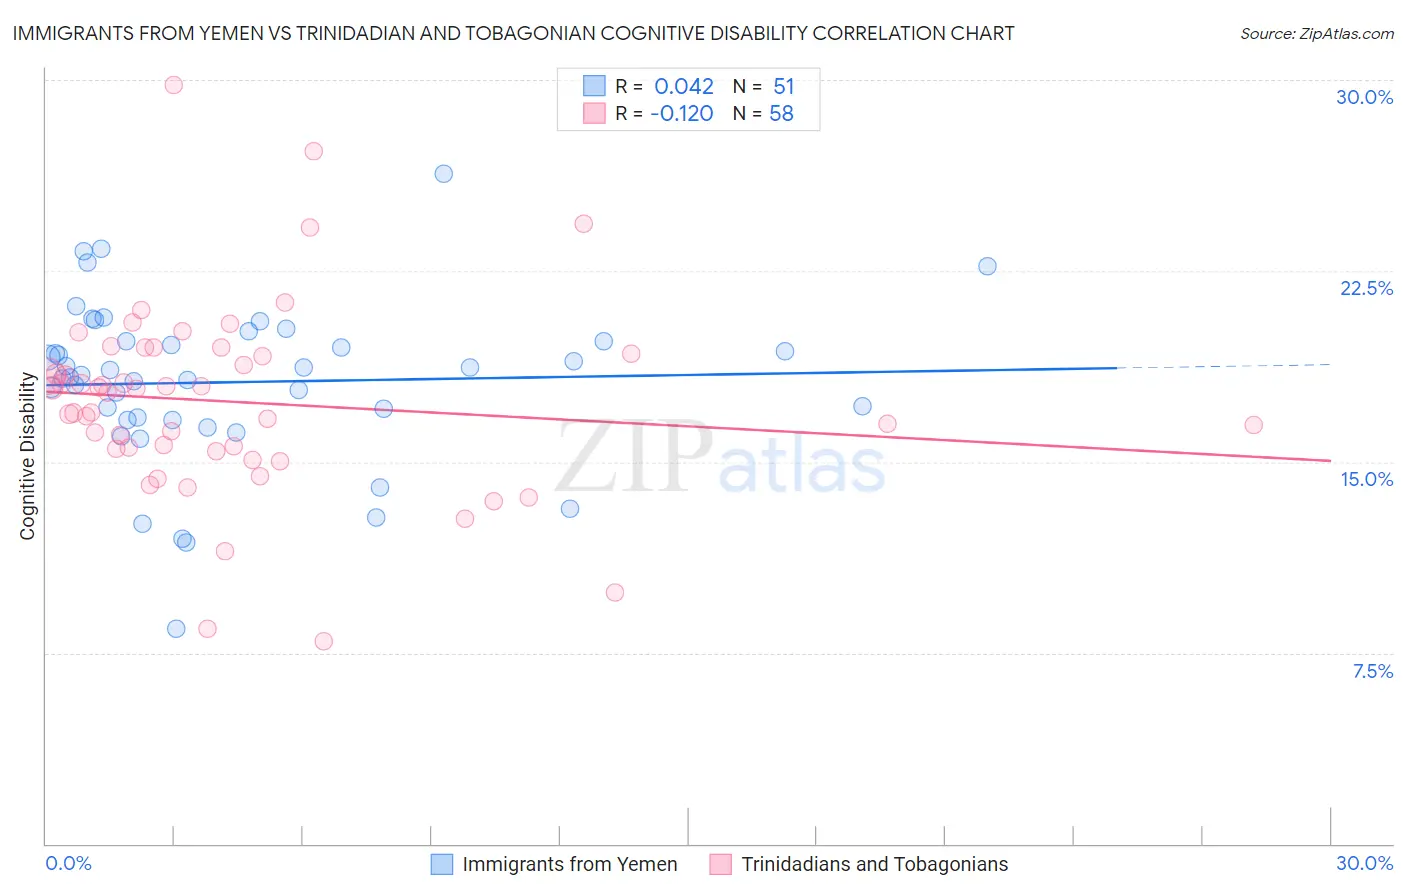
Immigrants from Yemen vs Trinidadian and Tobagonian Cognitive Disability Correlation Chart
The statistical analysis conducted on geographies consisting of 82,433,611 people shows no correlation between the proportion of Immigrants from Yemen and percentage of population with cognitive disability in the United States with a correlation coefficient (R) of 0.042 and weighted average of 18.8%. Similarly, the statistical analysis conducted on geographies consisting of 219,836,057 people shows a poor negative correlation between the proportion of Trinidadians and Tobagonians and percentage of population with cognitive disability in the United States with a correlation coefficient (R) of -0.120 and weighted average of 17.9%, a difference of 5.2%.
Cognitive Disability Correlation Summary
| Measurement | Immigrants from Yemen | Trinidadian and Tobagonian |
| Minimum | 8.4% | 7.9% |
| Maximum | 26.3% | 29.8% |
| Range | 17.9% | 21.9% |
| Mean | 18.1% | 17.4% |
| Median | 18.4% | 17.8% |
| Interquartile 25% (IQ1) | 16.6% | 15.5% |
| Interquartile 75% (IQ3) | 19.7% | 19.2% |
| Interquartile Range (IQR) | 3.1% | 3.7% |
| Standard Deviation (Sample) | 3.2% | 3.8% |
| Standard Deviation (Population) | 3.2% | 3.8% |
Similar Demographics by Cognitive Disability
Demographics Similar to Immigrants from Yemen by Cognitive Disability
In terms of cognitive disability, the demographic groups most similar to Immigrants from Yemen are Immigrants from Sudan (18.8%, a difference of 0.060%), Pima (18.8%, a difference of 0.070%), Immigrants from Dominican Republic (18.8%, a difference of 0.14%), Navajo (18.8%, a difference of 0.24%), and Sudanese (18.9%, a difference of 0.38%).
| Demographics | Rating | Rank | Cognitive Disability |
| Immigrants | Senegal | 0.0 /100 | #326 | Tragic 18.7% |
| U.S. Virgin Islanders | 0.0 /100 | #327 | Tragic 18.7% |
| Kiowa | 0.0 /100 | #328 | Tragic 18.7% |
| Navajo | 0.0 /100 | #329 | Tragic 18.8% |
| Immigrants | Dominican Republic | 0.0 /100 | #330 | Tragic 18.8% |
| Pima | 0.0 /100 | #331 | Tragic 18.8% |
| Immigrants | Sudan | 0.0 /100 | #332 | Tragic 18.8% |
| Immigrants | Yemen | 0.0 /100 | #333 | Tragic 18.8% |
| Sudanese | 0.0 /100 | #334 | Tragic 18.9% |
| Senegalese | 0.0 /100 | #335 | Tragic 19.0% |
| Blacks/African Americans | 0.0 /100 | #336 | Tragic 19.0% |
| Immigrants | Saudi Arabia | 0.0 /100 | #337 | Tragic 19.1% |
| Lumbee | 0.0 /100 | #338 | Tragic 19.1% |
| Puerto Ricans | 0.0 /100 | #339 | Tragic 19.2% |
| Cape Verdeans | 0.0 /100 | #340 | Tragic 19.2% |
Demographics Similar to Trinidadians and Tobagonians by Cognitive Disability
In terms of cognitive disability, the demographic groups most similar to Trinidadians and Tobagonians are Immigrants from Thailand (17.9%, a difference of 0.020%), Jamaican (17.9%, a difference of 0.090%), Samoan (17.9%, a difference of 0.090%), French American Indian (17.9%, a difference of 0.10%), and Immigrants from Bangladesh (17.8%, a difference of 0.13%).
| Demographics | Rating | Rank | Cognitive Disability |
| Cheyenne | 1.7 /100 | #238 | Tragic 17.8% |
| Cajuns | 1.4 /100 | #239 | Tragic 17.8% |
| Iraqis | 1.4 /100 | #240 | Tragic 17.8% |
| Mexicans | 1.1 /100 | #241 | Tragic 17.8% |
| Paiute | 1.1 /100 | #242 | Tragic 17.8% |
| Immigrants | Bangladesh | 1.0 /100 | #243 | Tragic 17.8% |
| Jamaicans | 0.9 /100 | #244 | Tragic 17.9% |
| Trinidadians and Tobagonians | 0.8 /100 | #245 | Tragic 17.9% |
| Immigrants | Thailand | 0.8 /100 | #246 | Tragic 17.9% |
| Samoans | 0.7 /100 | #247 | Tragic 17.9% |
| French American Indians | 0.7 /100 | #248 | Tragic 17.9% |
| Cree | 0.7 /100 | #249 | Tragic 17.9% |
| Immigrants | Ethiopia | 0.7 /100 | #250 | Tragic 17.9% |
| Malaysians | 0.6 /100 | #251 | Tragic 17.9% |
| Immigrants | Grenada | 0.6 /100 | #252 | Tragic 17.9% |