Immigrants from Trinidad and Tobago vs Trinidadian and Tobagonian Cognitive Disability
COMPARE
Immigrants from Trinidad and Tobago
Trinidadian and Tobagonian
Cognitive Disability
Cognitive Disability Comparison
Immigrants from Trinidad and Tobago
Trinidadians and Tobagonians
17.6%
COGNITIVE DISABILITY
8.7/ 100
METRIC RATING
209th/ 347
METRIC RANK
17.9%
COGNITIVE DISABILITY
0.8/ 100
METRIC RATING
245th/ 347
METRIC RANK
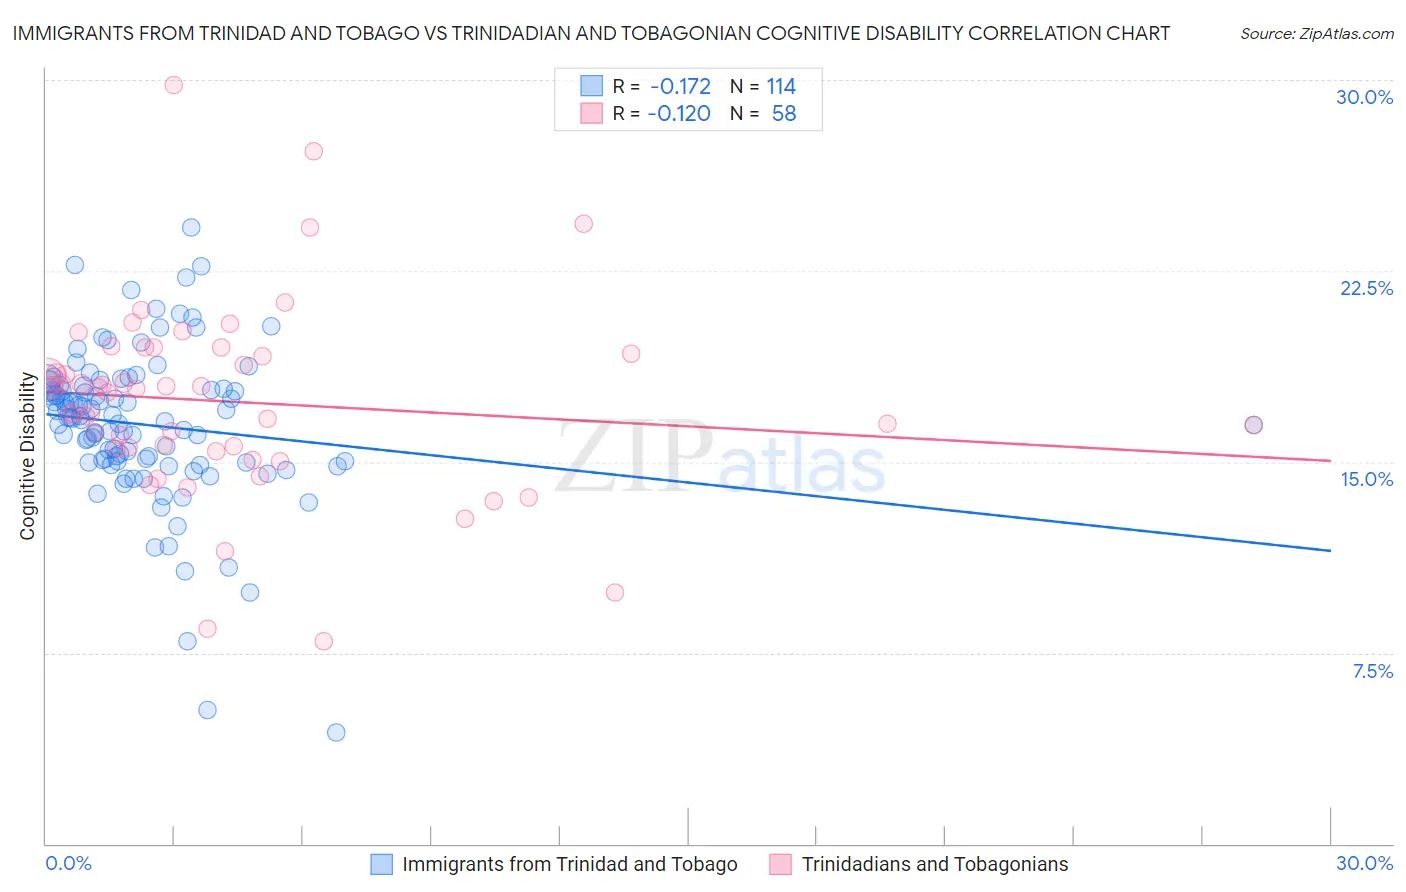
Immigrants from Trinidad and Tobago vs Trinidadian and Tobagonian Cognitive Disability Correlation Chart
The statistical analysis conducted on geographies consisting of 223,500,397 people shows a poor negative correlation between the proportion of Immigrants from Trinidad and Tobago and percentage of population with cognitive disability in the United States with a correlation coefficient (R) of -0.172 and weighted average of 17.6%. Similarly, the statistical analysis conducted on geographies consisting of 219,836,057 people shows a poor negative correlation between the proportion of Trinidadians and Tobagonians and percentage of population with cognitive disability in the United States with a correlation coefficient (R) of -0.120 and weighted average of 17.9%, a difference of 1.7%.
Cognitive Disability Correlation Summary
| Measurement | Immigrants from Trinidad and Tobago | Trinidadian and Tobagonian |
| Minimum | 4.4% | 7.9% |
| Maximum | 24.2% | 29.8% |
| Range | 19.8% | 21.9% |
| Mean | 16.4% | 17.4% |
| Median | 16.7% | 17.8% |
| Interquartile 25% (IQ1) | 15.0% | 15.5% |
| Interquartile 75% (IQ3) | 17.9% | 19.2% |
| Interquartile Range (IQR) | 2.9% | 3.7% |
| Standard Deviation (Sample) | 3.0% | 3.8% |
| Standard Deviation (Population) | 3.0% | 3.8% |
Similar Demographics by Cognitive Disability
Demographics Similar to Immigrants from Trinidad and Tobago by Cognitive Disability
In terms of cognitive disability, the demographic groups most similar to Immigrants from Trinidad and Tobago are Immigrants from Jamaica (17.6%, a difference of 0.020%), Immigrants from Cameroon (17.6%, a difference of 0.050%), Immigrants from Latin America (17.6%, a difference of 0.080%), Taiwanese (17.6%, a difference of 0.090%), and Alaska Native (17.5%, a difference of 0.13%).
| Demographics | Rating | Rank | Cognitive Disability |
| Immigrants | Morocco | 12.0 /100 | #202 | Poor 17.5% |
| Immigrants | Caribbean | 11.0 /100 | #203 | Poor 17.5% |
| Immigrants | Zimbabwe | 11.0 /100 | #204 | Poor 17.5% |
| Puget Sound Salish | 10.9 /100 | #205 | Poor 17.5% |
| Alaska Natives | 10.4 /100 | #206 | Poor 17.5% |
| Immigrants | Latin America | 9.7 /100 | #207 | Tragic 17.6% |
| Immigrants | Cameroon | 9.3 /100 | #208 | Tragic 17.6% |
| Immigrants | Trinidad and Tobago | 8.7 /100 | #209 | Tragic 17.6% |
| Immigrants | Jamaica | 8.5 /100 | #210 | Tragic 17.6% |
| Taiwanese | 7.7 /100 | #211 | Tragic 17.6% |
| Immigrants | Oceania | 7.3 /100 | #212 | Tragic 17.6% |
| Hawaiians | 7.2 /100 | #213 | Tragic 17.6% |
| Immigrants | El Salvador | 7.0 /100 | #214 | Tragic 17.6% |
| Alaskan Athabascans | 6.9 /100 | #215 | Tragic 17.6% |
| Okinawans | 6.8 /100 | #216 | Tragic 17.6% |
Demographics Similar to Trinidadians and Tobagonians by Cognitive Disability
In terms of cognitive disability, the demographic groups most similar to Trinidadians and Tobagonians are Immigrants from Thailand (17.9%, a difference of 0.020%), Jamaican (17.9%, a difference of 0.090%), Samoan (17.9%, a difference of 0.090%), French American Indian (17.9%, a difference of 0.10%), and Immigrants from Bangladesh (17.8%, a difference of 0.13%).
| Demographics | Rating | Rank | Cognitive Disability |
| Cheyenne | 1.7 /100 | #238 | Tragic 17.8% |
| Cajuns | 1.4 /100 | #239 | Tragic 17.8% |
| Iraqis | 1.4 /100 | #240 | Tragic 17.8% |
| Mexicans | 1.1 /100 | #241 | Tragic 17.8% |
| Paiute | 1.1 /100 | #242 | Tragic 17.8% |
| Immigrants | Bangladesh | 1.0 /100 | #243 | Tragic 17.8% |
| Jamaicans | 0.9 /100 | #244 | Tragic 17.9% |
| Trinidadians and Tobagonians | 0.8 /100 | #245 | Tragic 17.9% |
| Immigrants | Thailand | 0.8 /100 | #246 | Tragic 17.9% |
| Samoans | 0.7 /100 | #247 | Tragic 17.9% |
| French American Indians | 0.7 /100 | #248 | Tragic 17.9% |
| Cree | 0.7 /100 | #249 | Tragic 17.9% |
| Immigrants | Ethiopia | 0.7 /100 | #250 | Tragic 17.9% |
| Malaysians | 0.6 /100 | #251 | Tragic 17.9% |
| Immigrants | Grenada | 0.6 /100 | #252 | Tragic 17.9% |