Basque vs Immigrants from Latvia Cognitive Disability
COMPARE
Basque
Immigrants from Latvia
Cognitive Disability
Cognitive Disability Comparison
Basques
Immigrants from Latvia
17.1%
COGNITIVE DISABILITY
85.5/ 100
METRIC RATING
150th/ 347
METRIC RANK
17.2%
COGNITIVE DISABILITY
73.2/ 100
METRIC RATING
159th/ 347
METRIC RANK
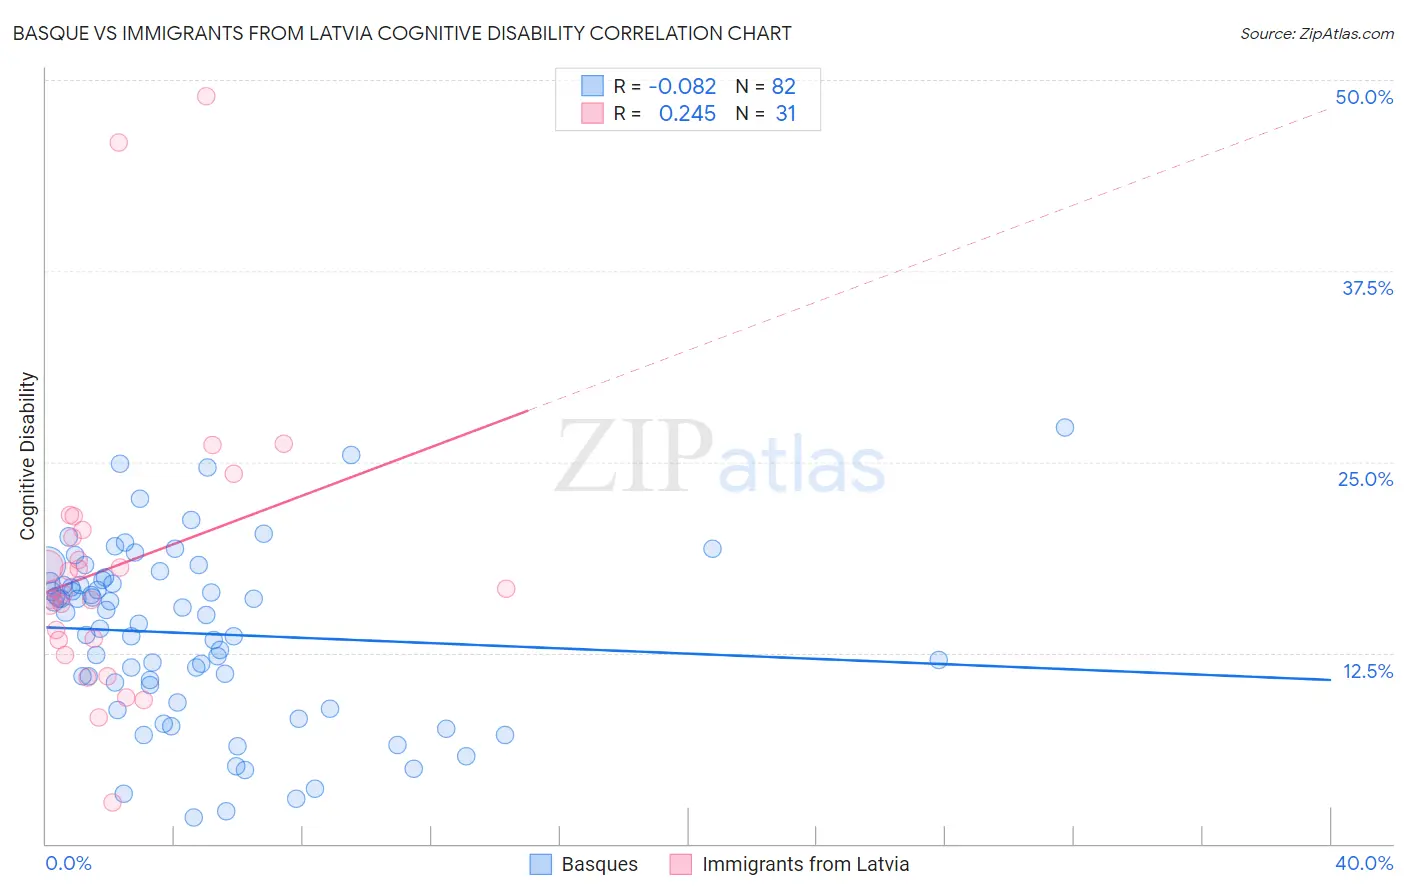
Basque vs Immigrants from Latvia Cognitive Disability Correlation Chart
The statistical analysis conducted on geographies consisting of 165,778,299 people shows a slight negative correlation between the proportion of Basques and percentage of population with cognitive disability in the United States with a correlation coefficient (R) of -0.082 and weighted average of 17.1%. Similarly, the statistical analysis conducted on geographies consisting of 113,738,689 people shows a weak positive correlation between the proportion of Immigrants from Latvia and percentage of population with cognitive disability in the United States with a correlation coefficient (R) of 0.245 and weighted average of 17.2%, a difference of 0.55%.
Cognitive Disability Correlation Summary
| Measurement | Basque | Immigrants from Latvia |
| Minimum | 1.7% | 2.7% |
| Maximum | 27.3% | 49.0% |
| Range | 25.6% | 46.2% |
| Mean | 13.8% | 18.2% |
| Median | 15.1% | 16.7% |
| Interquartile 25% (IQ1) | 10.4% | 13.4% |
| Interquartile 75% (IQ3) | 17.1% | 20.5% |
| Interquartile Range (IQR) | 6.7% | 7.2% |
| Standard Deviation (Sample) | 5.7% | 9.4% |
| Standard Deviation (Population) | 5.6% | 9.2% |
Demographics Similar to Basques and Immigrants from Latvia by Cognitive Disability
In terms of cognitive disability, the demographic groups most similar to Basques are French Canadian (17.1%, a difference of 0.010%), Cypriot (17.1%, a difference of 0.010%), Scotch-Irish (17.1%, a difference of 0.030%), Syrian (17.1%, a difference of 0.13%), and Immigrants from Indonesia (17.1%, a difference of 0.15%). Similarly, the demographic groups most similar to Immigrants from Latvia are Celtic (17.1%, a difference of 0.030%), Australian (17.2%, a difference of 0.030%), American (17.2%, a difference of 0.040%), Yugoslavian (17.2%, a difference of 0.060%), and Immigrants from Switzerland (17.2%, a difference of 0.060%).
| Demographics | Rating | Rank | Cognitive Disability |
| Immigrants | Brazil | 89.3 /100 | #144 | Excellent 17.0% |
| Immigrants | South Eastern Asia | 88.7 /100 | #145 | Excellent 17.0% |
| Costa Ricans | 88.0 /100 | #146 | Excellent 17.0% |
| Scotch-Irish | 85.9 /100 | #147 | Excellent 17.1% |
| French Canadians | 85.7 /100 | #148 | Excellent 17.1% |
| Cypriots | 85.7 /100 | #149 | Excellent 17.1% |
| Basques | 85.5 /100 | #150 | Excellent 17.1% |
| Syrians | 83.0 /100 | #151 | Excellent 17.1% |
| Immigrants | Indonesia | 82.7 /100 | #152 | Excellent 17.1% |
| Immigrants | Kazakhstan | 80.5 /100 | #153 | Excellent 17.1% |
| Immigrants | Malaysia | 79.3 /100 | #154 | Good 17.1% |
| Brazilians | 78.9 /100 | #155 | Good 17.1% |
| Sri Lankans | 78.9 /100 | #156 | Good 17.1% |
| Immigrants | Australia | 76.0 /100 | #157 | Good 17.1% |
| Celtics | 74.1 /100 | #158 | Good 17.1% |
| Immigrants | Latvia | 73.2 /100 | #159 | Good 17.2% |
| Australians | 72.4 /100 | #160 | Good 17.2% |
| Americans | 72.2 /100 | #161 | Good 17.2% |
| Yugoslavians | 71.6 /100 | #162 | Good 17.2% |
| Immigrants | Switzerland | 71.5 /100 | #163 | Good 17.2% |
| Armenians | 70.1 /100 | #164 | Good 17.2% |