Basque vs Immigrants from Burma/Myanmar Hearing Disability
COMPARE
Basque
Immigrants from Burma/Myanmar
Hearing Disability
Hearing Disability Comparison
Basques
Immigrants from Burma/Myanmar
3.6%
HEARING DISABILITY
0.0/ 100
METRIC RATING
278th/ 347
METRIC RANK
2.9%
HEARING DISABILITY
69.5/ 100
METRIC RATING
158th/ 347
METRIC RANK
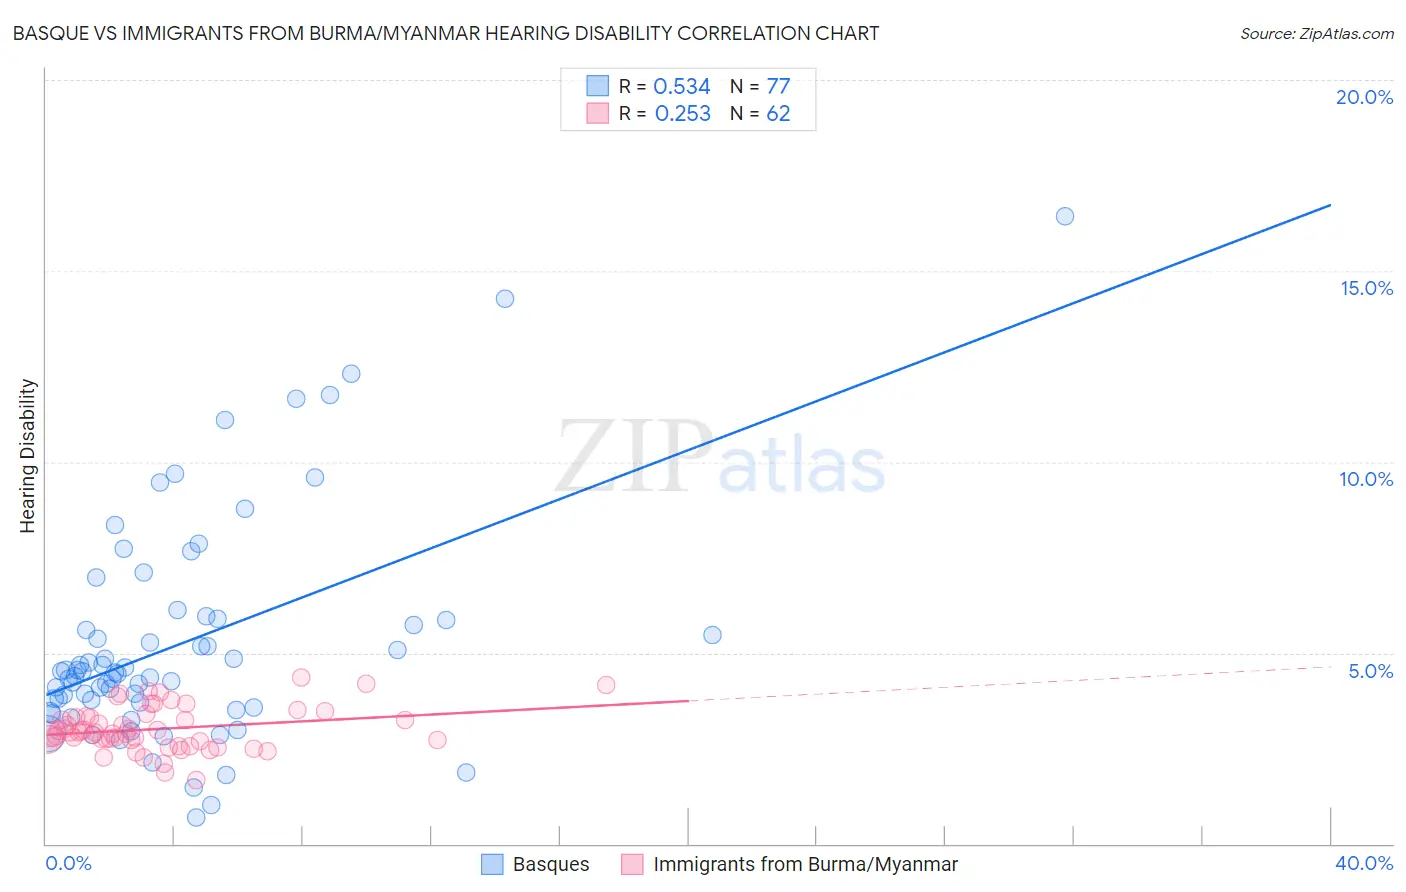
Basque vs Immigrants from Burma/Myanmar Hearing Disability Correlation Chart
The statistical analysis conducted on geographies consisting of 165,769,952 people shows a substantial positive correlation between the proportion of Basques and percentage of population with hearing disability in the United States with a correlation coefficient (R) of 0.534 and weighted average of 3.6%. Similarly, the statistical analysis conducted on geographies consisting of 172,316,169 people shows a weak positive correlation between the proportion of Immigrants from Burma/Myanmar and percentage of population with hearing disability in the United States with a correlation coefficient (R) of 0.253 and weighted average of 2.9%, a difference of 22.4%.
Hearing Disability Correlation Summary
| Measurement | Basque | Immigrants from Burma/Myanmar |
| Minimum | 0.68% | 1.7% |
| Maximum | 16.4% | 4.4% |
| Range | 15.7% | 2.7% |
| Mean | 5.3% | 3.0% |
| Median | 4.5% | 2.9% |
| Interquartile 25% (IQ1) | 3.6% | 2.7% |
| Interquartile 75% (IQ3) | 5.9% | 3.3% |
| Interquartile Range (IQR) | 2.2% | 0.60% |
| Standard Deviation (Sample) | 2.9% | 0.56% |
| Standard Deviation (Population) | 2.9% | 0.56% |
Similar Demographics by Hearing Disability
Demographics Similar to Basques by Hearing Disability
In terms of hearing disability, the demographic groups most similar to Basques are Slovak (3.6%, a difference of 0.26%), French American Indian (3.6%, a difference of 0.33%), Nonimmigrants (3.6%, a difference of 0.39%), Scandinavian (3.6%, a difference of 0.39%), and Swedish (3.6%, a difference of 0.48%).
| Demographics | Rating | Rank | Hearing Disability |
| Czechs | 0.1 /100 | #271 | Tragic 3.5% |
| Fijians | 0.0 /100 | #272 | Tragic 3.5% |
| Puerto Ricans | 0.0 /100 | #273 | Tragic 3.5% |
| Swiss | 0.0 /100 | #274 | Tragic 3.5% |
| Czechoslovakians | 0.0 /100 | #275 | Tragic 3.6% |
| Danes | 0.0 /100 | #276 | Tragic 3.6% |
| Immigrants | Nonimmigrants | 0.0 /100 | #277 | Tragic 3.6% |
| Basques | 0.0 /100 | #278 | Tragic 3.6% |
| Slovaks | 0.0 /100 | #279 | Tragic 3.6% |
| French American Indians | 0.0 /100 | #280 | Tragic 3.6% |
| Scandinavians | 0.0 /100 | #281 | Tragic 3.6% |
| Swedes | 0.0 /100 | #282 | Tragic 3.6% |
| Blackfeet | 0.0 /100 | #283 | Tragic 3.6% |
| Immigrants | Micronesia | 0.0 /100 | #284 | Tragic 3.6% |
| Sioux | 0.0 /100 | #285 | Tragic 3.6% |
Demographics Similar to Immigrants from Burma/Myanmar by Hearing Disability
In terms of hearing disability, the demographic groups most similar to Immigrants from Burma/Myanmar are Immigrants from Kazakhstan (2.9%, a difference of 0.010%), Immigrants from Poland (2.9%, a difference of 0.080%), Costa Rican (2.9%, a difference of 0.22%), Immigrants from Lebanon (2.9%, a difference of 0.23%), and Immigrants from Australia (2.9%, a difference of 0.23%).
| Demographics | Rating | Rank | Hearing Disability |
| Immigrants | France | 73.1 /100 | #151 | Good 2.9% |
| Immigrants | Lithuania | 73.0 /100 | #152 | Good 2.9% |
| Sudanese | 72.1 /100 | #153 | Good 2.9% |
| Immigrants | Lebanon | 71.5 /100 | #154 | Good 2.9% |
| Costa Ricans | 71.4 /100 | #155 | Good 2.9% |
| Immigrants | Poland | 70.2 /100 | #156 | Good 2.9% |
| Immigrants | Kazakhstan | 69.6 /100 | #157 | Good 2.9% |
| Immigrants | Burma/Myanmar | 69.5 /100 | #158 | Good 2.9% |
| Immigrants | Australia | 67.4 /100 | #159 | Good 2.9% |
| Immigrants | Fiji | 67.1 /100 | #160 | Good 2.9% |
| Albanians | 66.6 /100 | #161 | Good 2.9% |
| Immigrants | Japan | 66.3 /100 | #162 | Good 2.9% |
| Immigrants | Central America | 64.9 /100 | #163 | Good 3.0% |
| Immigrants | Cambodia | 64.8 /100 | #164 | Good 3.0% |
| Immigrants | Zimbabwe | 64.2 /100 | #165 | Good 3.0% |