Basque vs Ottawa Hearing Disability
COMPARE
Basque
Ottawa
Hearing Disability
Hearing Disability Comparison
Basques
Ottawa
3.6%
HEARING DISABILITY
0.0/ 100
METRIC RATING
278th/ 347
METRIC RANK
3.8%
HEARING DISABILITY
0.0/ 100
METRIC RATING
308th/ 347
METRIC RANK
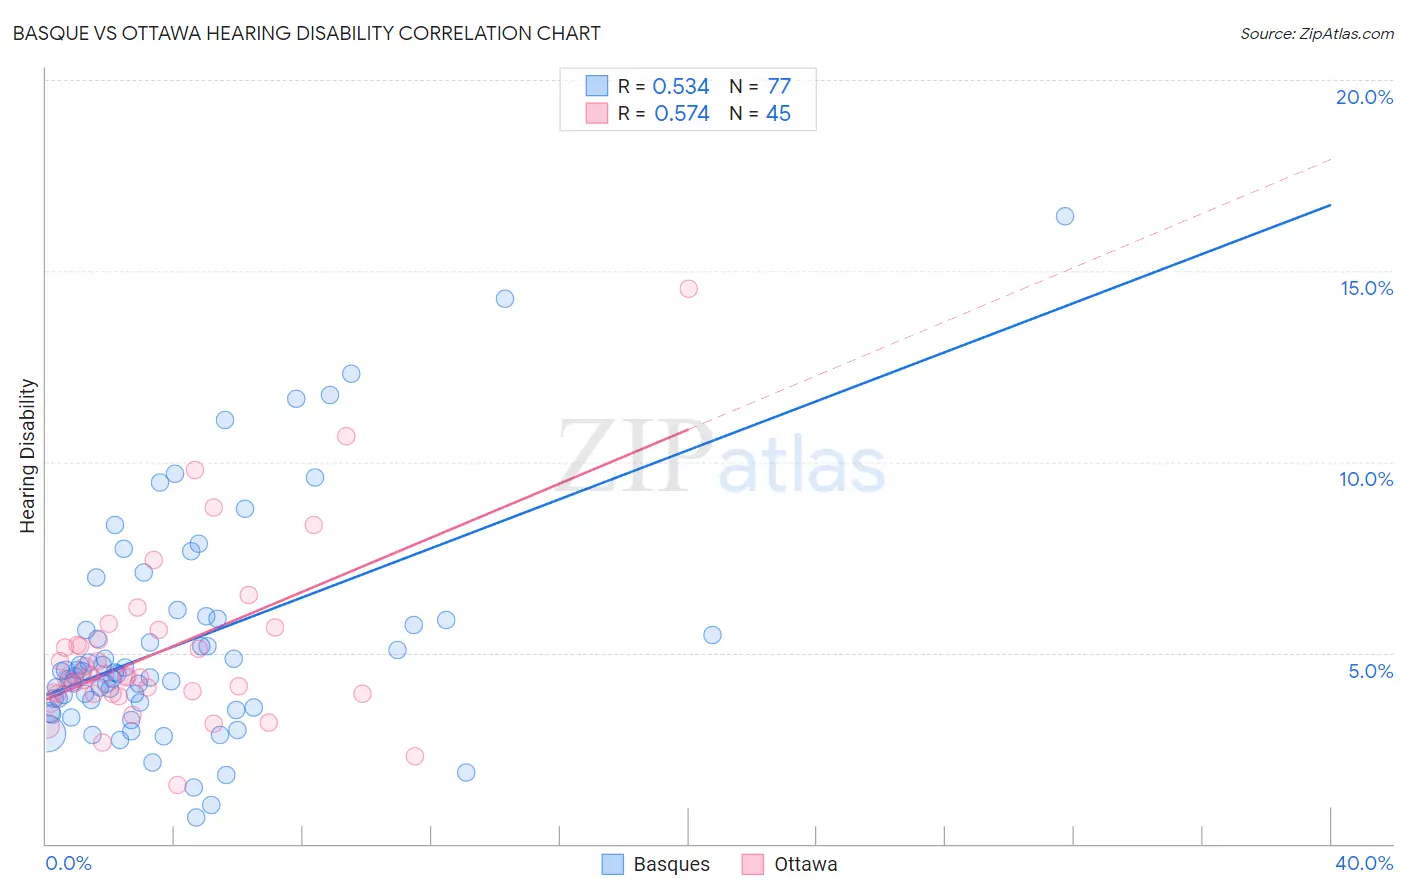
Basque vs Ottawa Hearing Disability Correlation Chart
The statistical analysis conducted on geographies consisting of 165,769,952 people shows a substantial positive correlation between the proportion of Basques and percentage of population with hearing disability in the United States with a correlation coefficient (R) of 0.534 and weighted average of 3.6%. Similarly, the statistical analysis conducted on geographies consisting of 49,954,847 people shows a substantial positive correlation between the proportion of Ottawa and percentage of population with hearing disability in the United States with a correlation coefficient (R) of 0.574 and weighted average of 3.8%, a difference of 6.5%.
Hearing Disability Correlation Summary
| Measurement | Basque | Ottawa |
| Minimum | 0.68% | 1.5% |
| Maximum | 16.4% | 14.5% |
| Range | 15.7% | 13.0% |
| Mean | 5.3% | 5.0% |
| Median | 4.5% | 4.4% |
| Interquartile 25% (IQ1) | 3.6% | 3.9% |
| Interquartile 75% (IQ3) | 5.9% | 5.5% |
| Interquartile Range (IQR) | 2.2% | 1.5% |
| Standard Deviation (Sample) | 2.9% | 2.3% |
| Standard Deviation (Population) | 2.9% | 2.3% |
Similar Demographics by Hearing Disability
Demographics Similar to Basques by Hearing Disability
In terms of hearing disability, the demographic groups most similar to Basques are Slovak (3.6%, a difference of 0.26%), French American Indian (3.6%, a difference of 0.33%), Nonimmigrants (3.6%, a difference of 0.39%), Scandinavian (3.6%, a difference of 0.39%), and Swedish (3.6%, a difference of 0.48%).
| Demographics | Rating | Rank | Hearing Disability |
| Czechs | 0.1 /100 | #271 | Tragic 3.5% |
| Fijians | 0.0 /100 | #272 | Tragic 3.5% |
| Puerto Ricans | 0.0 /100 | #273 | Tragic 3.5% |
| Swiss | 0.0 /100 | #274 | Tragic 3.5% |
| Czechoslovakians | 0.0 /100 | #275 | Tragic 3.6% |
| Danes | 0.0 /100 | #276 | Tragic 3.6% |
| Immigrants | Nonimmigrants | 0.0 /100 | #277 | Tragic 3.6% |
| Basques | 0.0 /100 | #278 | Tragic 3.6% |
| Slovaks | 0.0 /100 | #279 | Tragic 3.6% |
| French American Indians | 0.0 /100 | #280 | Tragic 3.6% |
| Scandinavians | 0.0 /100 | #281 | Tragic 3.6% |
| Swedes | 0.0 /100 | #282 | Tragic 3.6% |
| Blackfeet | 0.0 /100 | #283 | Tragic 3.6% |
| Immigrants | Micronesia | 0.0 /100 | #284 | Tragic 3.6% |
| Sioux | 0.0 /100 | #285 | Tragic 3.6% |
Demographics Similar to Ottawa by Hearing Disability
In terms of hearing disability, the demographic groups most similar to Ottawa are Scotch-Irish (3.8%, a difference of 0.080%), Cree (3.8%, a difference of 0.39%), French Canadian (3.8%, a difference of 0.44%), Marshallese (3.8%, a difference of 0.56%), and English (3.8%, a difference of 1.4%).
| Demographics | Rating | Rank | Hearing Disability |
| Pennsylvania Germans | 0.0 /100 | #301 | Tragic 3.7% |
| Dutch | 0.0 /100 | #302 | Tragic 3.7% |
| Menominee | 0.0 /100 | #303 | Tragic 3.7% |
| French | 0.0 /100 | #304 | Tragic 3.8% |
| English | 0.0 /100 | #305 | Tragic 3.8% |
| Marshallese | 0.0 /100 | #306 | Tragic 3.8% |
| French Canadians | 0.0 /100 | #307 | Tragic 3.8% |
| Ottawa | 0.0 /100 | #308 | Tragic 3.8% |
| Scotch-Irish | 0.0 /100 | #309 | Tragic 3.8% |
| Cree | 0.0 /100 | #310 | Tragic 3.8% |
| Americans | 0.0 /100 | #311 | Tragic 3.9% |
| Cajuns | 0.0 /100 | #312 | Tragic 3.9% |
| Hopi | 0.0 /100 | #313 | Tragic 3.9% |
| Yakama | 0.0 /100 | #314 | Tragic 3.9% |
| Puget Sound Salish | 0.0 /100 | #315 | Tragic 3.9% |