Immigrants from Egypt vs U.S. Virgin Islander Male Disability
COMPARE
Immigrants from Egypt
U.S. Virgin Islander
Male Disability
Male Disability Comparison
Immigrants from Egypt
U.S. Virgin Islanders
10.1%
MALE DISABILITY
99.9/ 100
METRIC RATING
30th/ 347
METRIC RANK
11.9%
MALE DISABILITY
1.3/ 100
METRIC RATING
236th/ 347
METRIC RANK
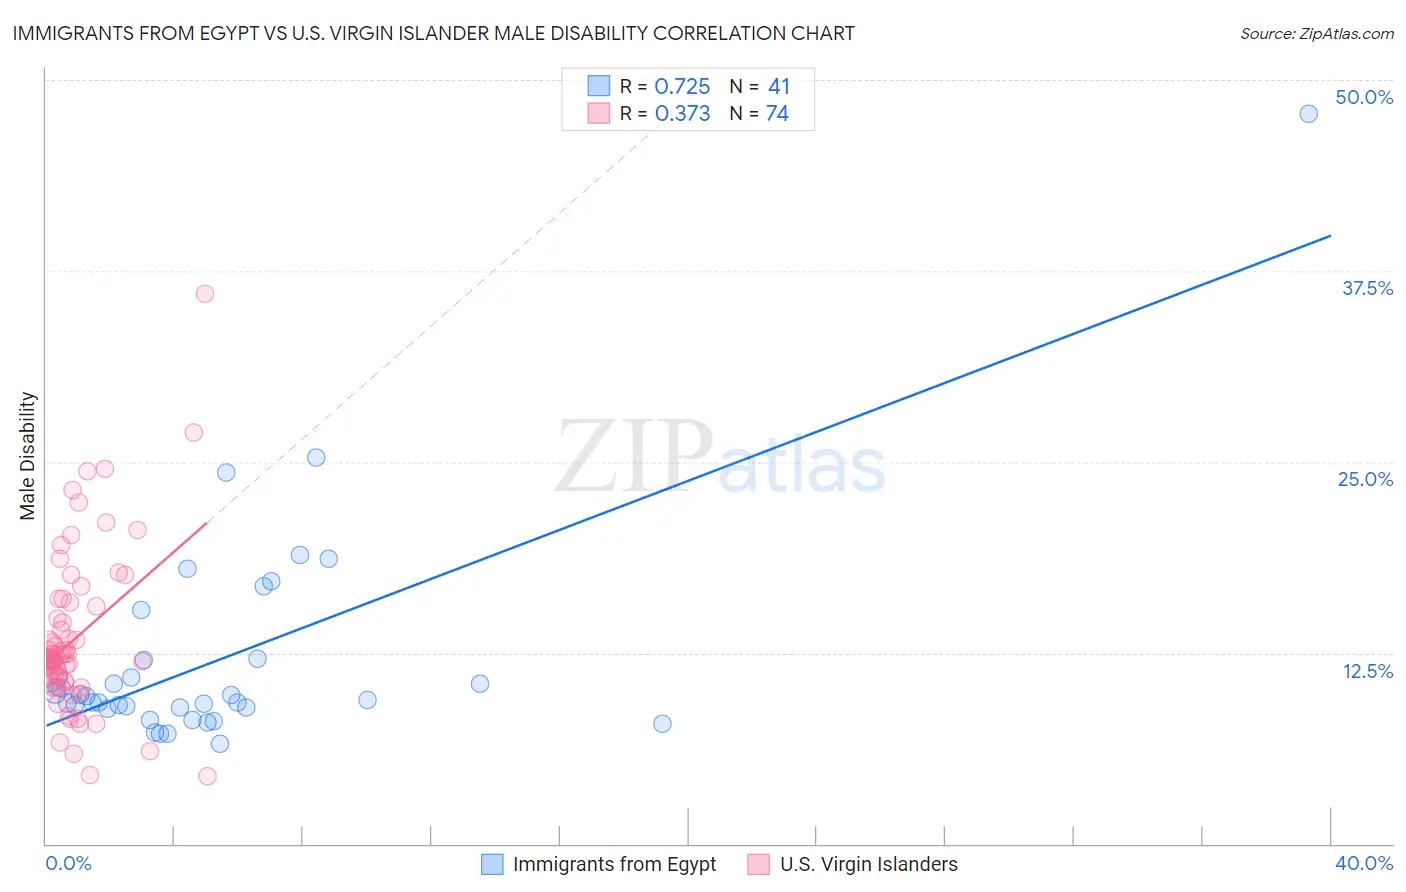
Immigrants from Egypt vs U.S. Virgin Islander Male Disability Correlation Chart
The statistical analysis conducted on geographies consisting of 245,488,191 people shows a strong positive correlation between the proportion of Immigrants from Egypt and percentage of males with a disability in the United States with a correlation coefficient (R) of 0.725 and weighted average of 10.1%. Similarly, the statistical analysis conducted on geographies consisting of 87,521,484 people shows a mild positive correlation between the proportion of U.S. Virgin Islanders and percentage of males with a disability in the United States with a correlation coefficient (R) of 0.373 and weighted average of 11.9%, a difference of 17.5%.
Male Disability Correlation Summary
| Measurement | Immigrants from Egypt | U.S. Virgin Islander |
| Minimum | 6.5% | 4.4% |
| Maximum | 47.8% | 36.0% |
| Range | 41.3% | 31.6% |
| Mean | 12.1% | 13.4% |
| Median | 9.4% | 12.1% |
| Interquartile 25% (IQ1) | 8.9% | 10.6% |
| Interquartile 75% (IQ3) | 12.0% | 15.5% |
| Interquartile Range (IQR) | 3.2% | 4.9% |
| Standard Deviation (Sample) | 7.3% | 5.3% |
| Standard Deviation (Population) | 7.2% | 5.3% |
Similar Demographics by Male Disability
Demographics Similar to Immigrants from Egypt by Male Disability
In terms of male disability, the demographic groups most similar to Immigrants from Egypt are Venezuelan (10.1%, a difference of 0.040%), Soviet Union (10.1%, a difference of 0.070%), Vietnamese (10.1%, a difference of 0.19%), Egyptian (10.1%, a difference of 0.21%), and Argentinean (10.1%, a difference of 0.22%).
| Demographics | Rating | Rank | Male Disability |
| Cypriots | 100.0 /100 | #23 | Exceptional 10.0% |
| Immigrants | Asia | 100.0 /100 | #24 | Exceptional 10.0% |
| Immigrants | Malaysia | 99.9 /100 | #25 | Exceptional 10.0% |
| Paraguayans | 99.9 /100 | #26 | Exceptional 10.1% |
| Egyptians | 99.9 /100 | #27 | Exceptional 10.1% |
| Vietnamese | 99.9 /100 | #28 | Exceptional 10.1% |
| Venezuelans | 99.9 /100 | #29 | Exceptional 10.1% |
| Immigrants | Egypt | 99.9 /100 | #30 | Exceptional 10.1% |
| Soviet Union | 99.9 /100 | #31 | Exceptional 10.1% |
| Argentineans | 99.9 /100 | #32 | Exceptional 10.1% |
| Immigrants | Ethiopia | 99.9 /100 | #33 | Exceptional 10.2% |
| Immigrants | Turkey | 99.9 /100 | #34 | Exceptional 10.2% |
| Immigrants | Argentina | 99.9 /100 | #35 | Exceptional 10.2% |
| Ethiopians | 99.8 /100 | #36 | Exceptional 10.2% |
| Immigrants | Indonesia | 99.8 /100 | #37 | Exceptional 10.2% |
Demographics Similar to U.S. Virgin Islanders by Male Disability
In terms of male disability, the demographic groups most similar to U.S. Virgin Islanders are Carpatho Rusyn (11.9%, a difference of 0.010%), Yugoslavian (11.9%, a difference of 0.11%), Immigrants from North America (11.9%, a difference of 0.14%), Italian (11.9%, a difference of 0.16%), and Czech (11.9%, a difference of 0.21%).
| Demographics | Rating | Rank | Male Disability |
| Bermudans | 2.3 /100 | #229 | Tragic 11.8% |
| Croatians | 2.1 /100 | #230 | Tragic 11.8% |
| Dominicans | 1.8 /100 | #231 | Tragic 11.8% |
| Malaysians | 1.8 /100 | #232 | Tragic 11.8% |
| Mexicans | 1.7 /100 | #233 | Tragic 11.8% |
| Immigrants | Canada | 1.6 /100 | #234 | Tragic 11.9% |
| Immigrants | North America | 1.5 /100 | #235 | Tragic 11.9% |
| U.S. Virgin Islanders | 1.3 /100 | #236 | Tragic 11.9% |
| Carpatho Rusyns | 1.3 /100 | #237 | Tragic 11.9% |
| Yugoslavians | 1.2 /100 | #238 | Tragic 11.9% |
| Italians | 1.2 /100 | #239 | Tragic 11.9% |
| Czechs | 1.1 /100 | #240 | Tragic 11.9% |
| Bahamians | 1.1 /100 | #241 | Tragic 11.9% |
| Northern Europeans | 1.1 /100 | #242 | Tragic 11.9% |
| Samoans | 1.1 /100 | #243 | Tragic 11.9% |