Barbadian vs Pueblo Disability Age Over 75
COMPARE
Barbadian
Pueblo
Disability Age Over 75
Disability Age Over 75 Comparison
Barbadians
Pueblo
48.0%
DISABILITY AGE OVER 75
6.8/ 100
METRIC RATING
222nd/ 347
METRIC RANK
55.9%
DISABILITY AGE OVER 75
0.0/ 100
METRIC RATING
340th/ 347
METRIC RANK
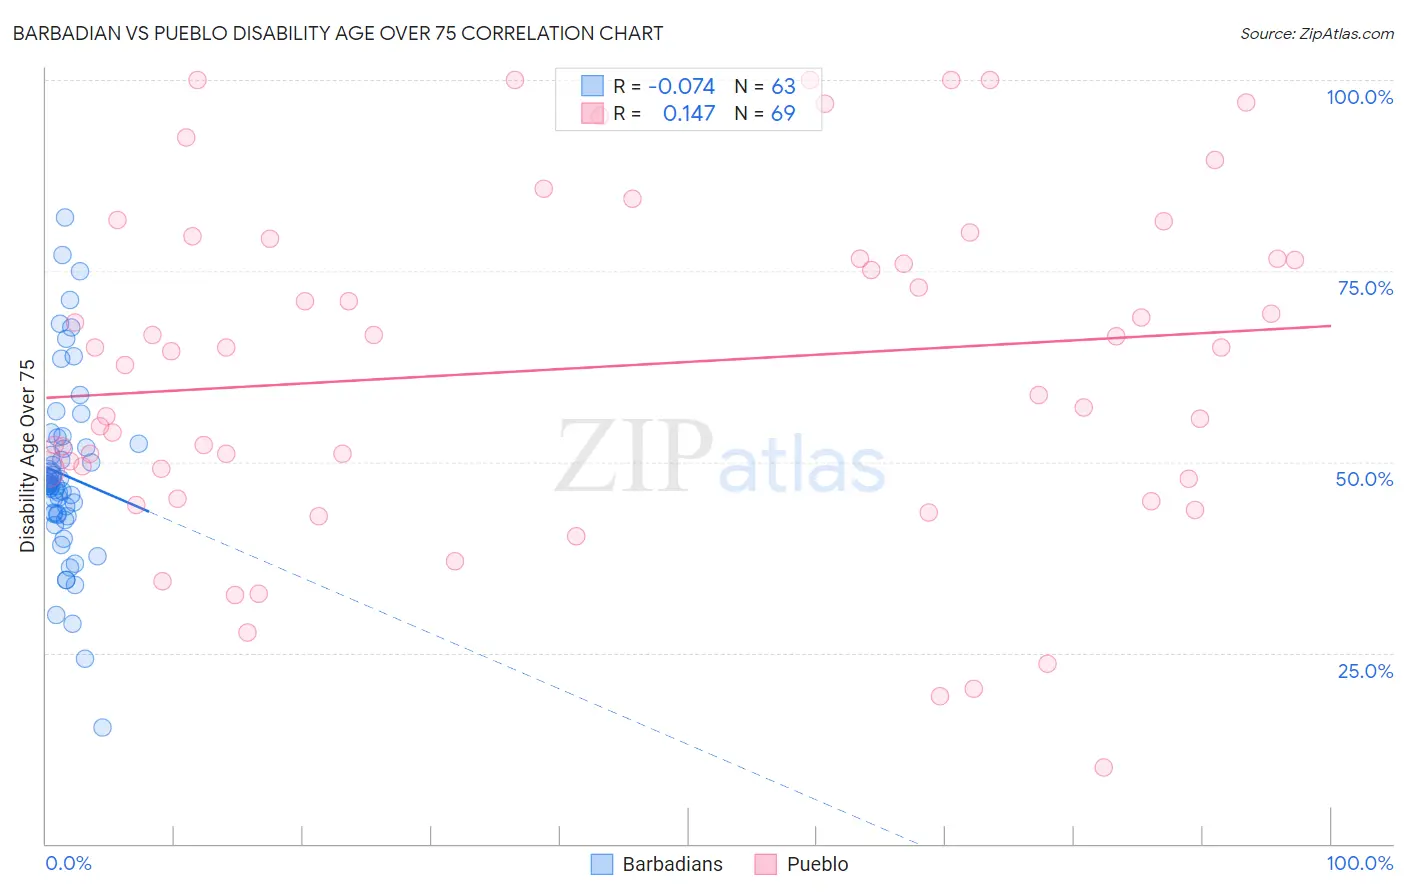
Barbadian vs Pueblo Disability Age Over 75 Correlation Chart
The statistical analysis conducted on geographies consisting of 141,188,611 people shows a slight negative correlation between the proportion of Barbadians and percentage of population with a disability over the age of 75 in the United States with a correlation coefficient (R) of -0.074 and weighted average of 48.0%. Similarly, the statistical analysis conducted on geographies consisting of 119,996,484 people shows a poor positive correlation between the proportion of Pueblo and percentage of population with a disability over the age of 75 in the United States with a correlation coefficient (R) of 0.147 and weighted average of 55.9%, a difference of 16.3%.
Disability Age Over 75 Correlation Summary
| Measurement | Barbadian | Pueblo |
| Minimum | 15.2% | 10.0% |
| Maximum | 82.0% | 100.0% |
| Range | 66.8% | 90.0% |
| Mean | 48.3% | 62.3% |
| Median | 46.9% | 64.5% |
| Interquartile 25% (IQ1) | 43.1% | 48.4% |
| Interquartile 75% (IQ3) | 52.4% | 77.9% |
| Interquartile Range (IQR) | 9.3% | 29.5% |
| Standard Deviation (Sample) | 12.0% | 22.0% |
| Standard Deviation (Population) | 11.9% | 21.8% |
Similar Demographics by Disability Age Over 75
Demographics Similar to Barbadians by Disability Age Over 75
In terms of disability age over 75, the demographic groups most similar to Barbadians are Immigrants from Bangladesh (48.0%, a difference of 0.0%), Liberian (48.0%, a difference of 0.010%), Spanish (48.0%, a difference of 0.030%), Nonimmigrants (48.0%, a difference of 0.030%), and Immigrants from Oceania (48.0%, a difference of 0.040%).
| Demographics | Rating | Rank | Disability Age Over 75 |
| Senegalese | 10.7 /100 | #215 | Poor 47.9% |
| Immigrants | Panama | 10.2 /100 | #216 | Poor 47.9% |
| Immigrants | Grenada | 9.4 /100 | #217 | Tragic 47.9% |
| Immigrants | Western Africa | 8.3 /100 | #218 | Tragic 48.0% |
| Immigrants | Western Asia | 7.5 /100 | #219 | Tragic 48.0% |
| Bahamians | 7.4 /100 | #220 | Tragic 48.0% |
| Immigrants | Oceania | 7.3 /100 | #221 | Tragic 48.0% |
| Barbadians | 6.8 /100 | #222 | Tragic 48.0% |
| Immigrants | Bangladesh | 6.8 /100 | #223 | Tragic 48.0% |
| Liberians | 6.7 /100 | #224 | Tragic 48.0% |
| Spanish | 6.5 /100 | #225 | Tragic 48.0% |
| Immigrants | Nonimmigrants | 6.5 /100 | #226 | Tragic 48.0% |
| Zimbabweans | 6.4 /100 | #227 | Tragic 48.1% |
| Immigrants | Liberia | 5.9 /100 | #228 | Tragic 48.1% |
| Spaniards | 5.7 /100 | #229 | Tragic 48.1% |
Demographics Similar to Pueblo by Disability Age Over 75
In terms of disability age over 75, the demographic groups most similar to Pueblo are Pima (55.8%, a difference of 0.080%), Houma (56.2%, a difference of 0.51%), Lumbee (56.2%, a difference of 0.67%), Colville (55.4%, a difference of 0.90%), and Tohono O'odham (56.7%, a difference of 1.5%).
| Demographics | Rating | Rank | Disability Age Over 75 |
| Apache | 0.0 /100 | #333 | Tragic 53.6% |
| Alaskan Athabascans | 0.0 /100 | #334 | Tragic 54.0% |
| Kiowa | 0.0 /100 | #335 | Tragic 54.2% |
| Immigrants | Armenia | 0.0 /100 | #336 | Tragic 54.3% |
| Yuman | 0.0 /100 | #337 | Tragic 54.4% |
| Colville | 0.0 /100 | #338 | Tragic 55.4% |
| Pima | 0.0 /100 | #339 | Tragic 55.8% |
| Pueblo | 0.0 /100 | #340 | Tragic 55.9% |
| Houma | 0.0 /100 | #341 | Tragic 56.2% |
| Lumbee | 0.0 /100 | #342 | Tragic 56.2% |
| Tohono O'odham | 0.0 /100 | #343 | Tragic 56.7% |
| Navajo | 0.0 /100 | #344 | Tragic 58.3% |
| Inupiat | 0.0 /100 | #345 | Tragic 58.4% |
| Tsimshian | 0.0 /100 | #346 | Tragic 59.2% |
| Yup'ik | 0.0 /100 | #347 | Tragic 61.1% |