Barbadian vs Tongan In Labor Force | Age 30-34
COMPARE
Barbadian
Tongan
In Labor Force | Age 30-34
In Labor Force | Age 30-34 Comparison
Barbadians
Tongans
84.6%
IN LABOR FORCE | AGE 30-34
36.7/ 100
METRIC RATING
182nd/ 347
METRIC RANK
83.5%
IN LABOR FORCE | AGE 30-34
0.0/ 100
METRIC RATING
276th/ 347
METRIC RANK
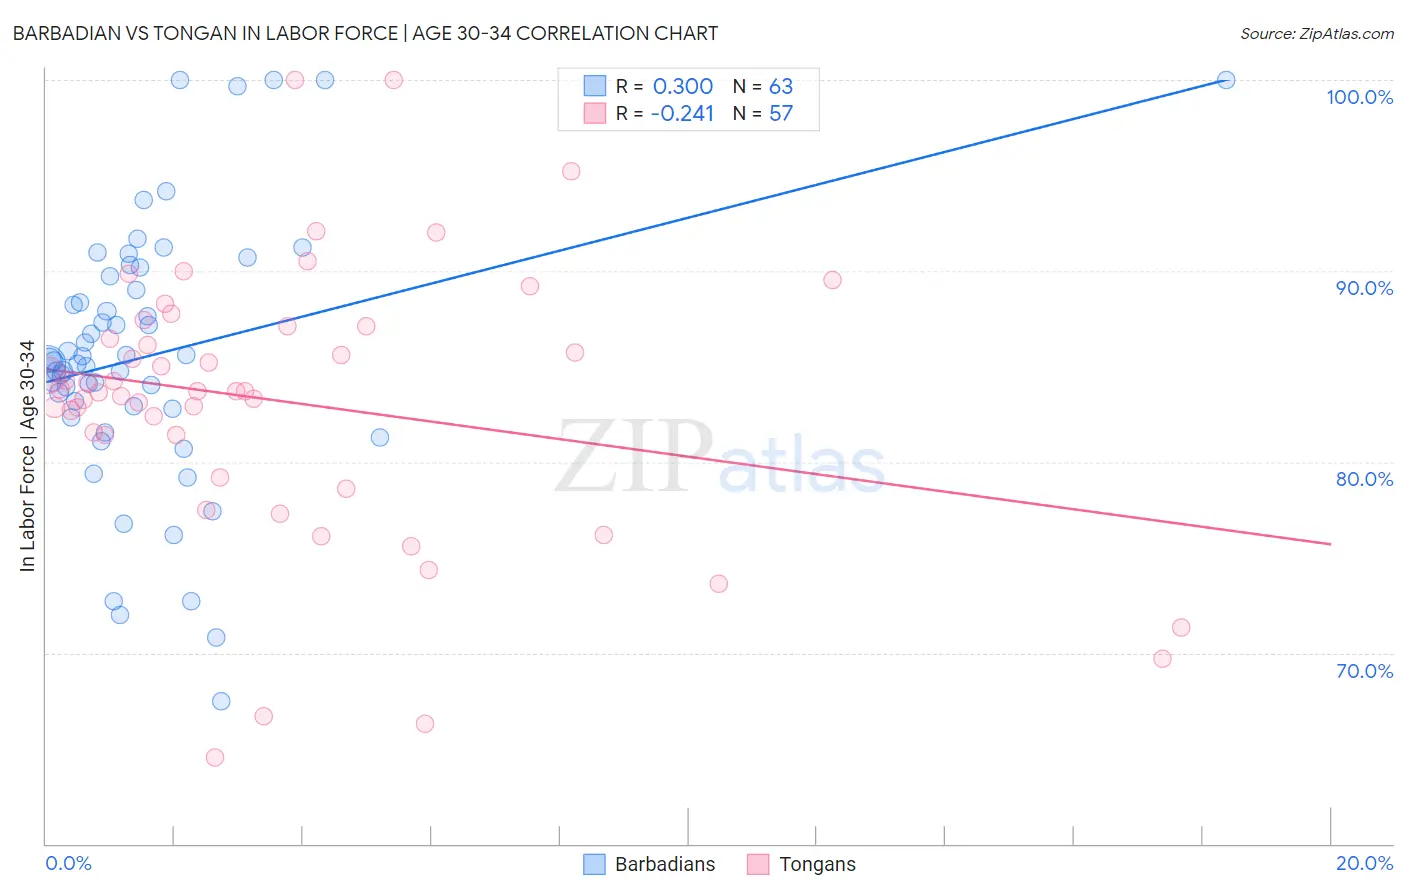
Barbadian vs Tongan In Labor Force | Age 30-34 Correlation Chart
The statistical analysis conducted on geographies consisting of 141,265,054 people shows a weak positive correlation between the proportion of Barbadians and labor force participation rate among population between the ages 30 and 34 in the United States with a correlation coefficient (R) of 0.300 and weighted average of 84.6%. Similarly, the statistical analysis conducted on geographies consisting of 102,882,684 people shows a weak negative correlation between the proportion of Tongans and labor force participation rate among population between the ages 30 and 34 in the United States with a correlation coefficient (R) of -0.241 and weighted average of 83.5%, a difference of 1.4%.
In Labor Force | Age 30-34 Correlation Summary
| Measurement | Barbadian | Tongan |
| Minimum | 67.5% | 64.5% |
| Maximum | 100.0% | 100.0% |
| Range | 32.5% | 35.5% |
| Mean | 85.6% | 83.2% |
| Median | 85.3% | 83.7% |
| Interquartile 25% (IQ1) | 82.8% | 80.3% |
| Interquartile 75% (IQ3) | 89.7% | 87.1% |
| Interquartile Range (IQR) | 6.9% | 6.8% |
| Standard Deviation (Sample) | 6.9% | 7.2% |
| Standard Deviation (Population) | 6.9% | 7.1% |
Similar Demographics by In Labor Force | Age 30-34
Demographics Similar to Barbadians by In Labor Force | Age 30-34
In terms of in labor force | age 30-34, the demographic groups most similar to Barbadians are Immigrants from Canada (84.6%, a difference of 0.010%), Moroccan (84.6%, a difference of 0.030%), Immigrants from North America (84.6%, a difference of 0.030%), Immigrants from Nigeria (84.6%, a difference of 0.040%), and Immigrants from Netherlands (84.6%, a difference of 0.040%).
| Demographics | Rating | Rank | In Labor Force | Age 30-34 |
| Immigrants | South America | 50.0 /100 | #175 | Average 84.7% |
| Immigrants | Uzbekistan | 49.1 /100 | #176 | Average 84.7% |
| Laotians | 46.9 /100 | #177 | Average 84.7% |
| Okinawans | 44.1 /100 | #178 | Average 84.6% |
| Immigrants | Nigeria | 42.5 /100 | #179 | Average 84.6% |
| Immigrants | Netherlands | 42.1 /100 | #180 | Average 84.6% |
| Moroccans | 40.3 /100 | #181 | Average 84.6% |
| Barbadians | 36.7 /100 | #182 | Fair 84.6% |
| Immigrants | Canada | 35.0 /100 | #183 | Fair 84.6% |
| Immigrants | North America | 33.3 /100 | #184 | Fair 84.6% |
| Immigrants | Philippines | 31.5 /100 | #185 | Fair 84.6% |
| Immigrants | Congo | 29.7 /100 | #186 | Fair 84.6% |
| Costa Ricans | 29.6 /100 | #187 | Fair 84.6% |
| Taiwanese | 29.4 /100 | #188 | Fair 84.6% |
| Nigerians | 28.9 /100 | #189 | Fair 84.5% |
Demographics Similar to Tongans by In Labor Force | Age 30-34
In terms of in labor force | age 30-34, the demographic groups most similar to Tongans are Immigrants from Grenada (83.5%, a difference of 0.010%), Guamanian/Chamorro (83.5%, a difference of 0.020%), Belizean (83.5%, a difference of 0.020%), Delaware (83.5%, a difference of 0.020%), and Fijian (83.4%, a difference of 0.070%).
| Demographics | Rating | Rank | In Labor Force | Age 30-34 |
| Vietnamese | 0.1 /100 | #269 | Tragic 83.6% |
| Spanish Americans | 0.0 /100 | #270 | Tragic 83.5% |
| Spanish | 0.0 /100 | #271 | Tragic 83.5% |
| Immigrants | Nonimmigrants | 0.0 /100 | #272 | Tragic 83.5% |
| Guamanians/Chamorros | 0.0 /100 | #273 | Tragic 83.5% |
| Belizeans | 0.0 /100 | #274 | Tragic 83.5% |
| Immigrants | Grenada | 0.0 /100 | #275 | Tragic 83.5% |
| Tongans | 0.0 /100 | #276 | Tragic 83.5% |
| Delaware | 0.0 /100 | #277 | Tragic 83.5% |
| Fijians | 0.0 /100 | #278 | Tragic 83.4% |
| Immigrants | Fiji | 0.0 /100 | #279 | Tragic 83.4% |
| Africans | 0.0 /100 | #280 | Tragic 83.4% |
| Samoans | 0.0 /100 | #281 | Tragic 83.3% |
| Mexican American Indians | 0.0 /100 | #282 | Tragic 83.2% |
| Assyrians/Chaldeans/Syriacs | 0.0 /100 | #283 | Tragic 83.2% |