Barbadian vs Tongan Unemployment Among Ages 65 to 74 years
COMPARE
Barbadian
Tongan
Unemployment Among Ages 65 to 74 years
Unemployment Among Ages 65 to 74 years Comparison
Barbadians
Tongans
5.8%
UNEMPLOYMENT AMONG AGES 65 TO 74 YEARS
0.0/ 100
METRIC RATING
299th/ 347
METRIC RANK
4.7%
UNEMPLOYMENT AMONG AGES 65 TO 74 YEARS
100.0/ 100
METRIC RATING
12th/ 347
METRIC RANK
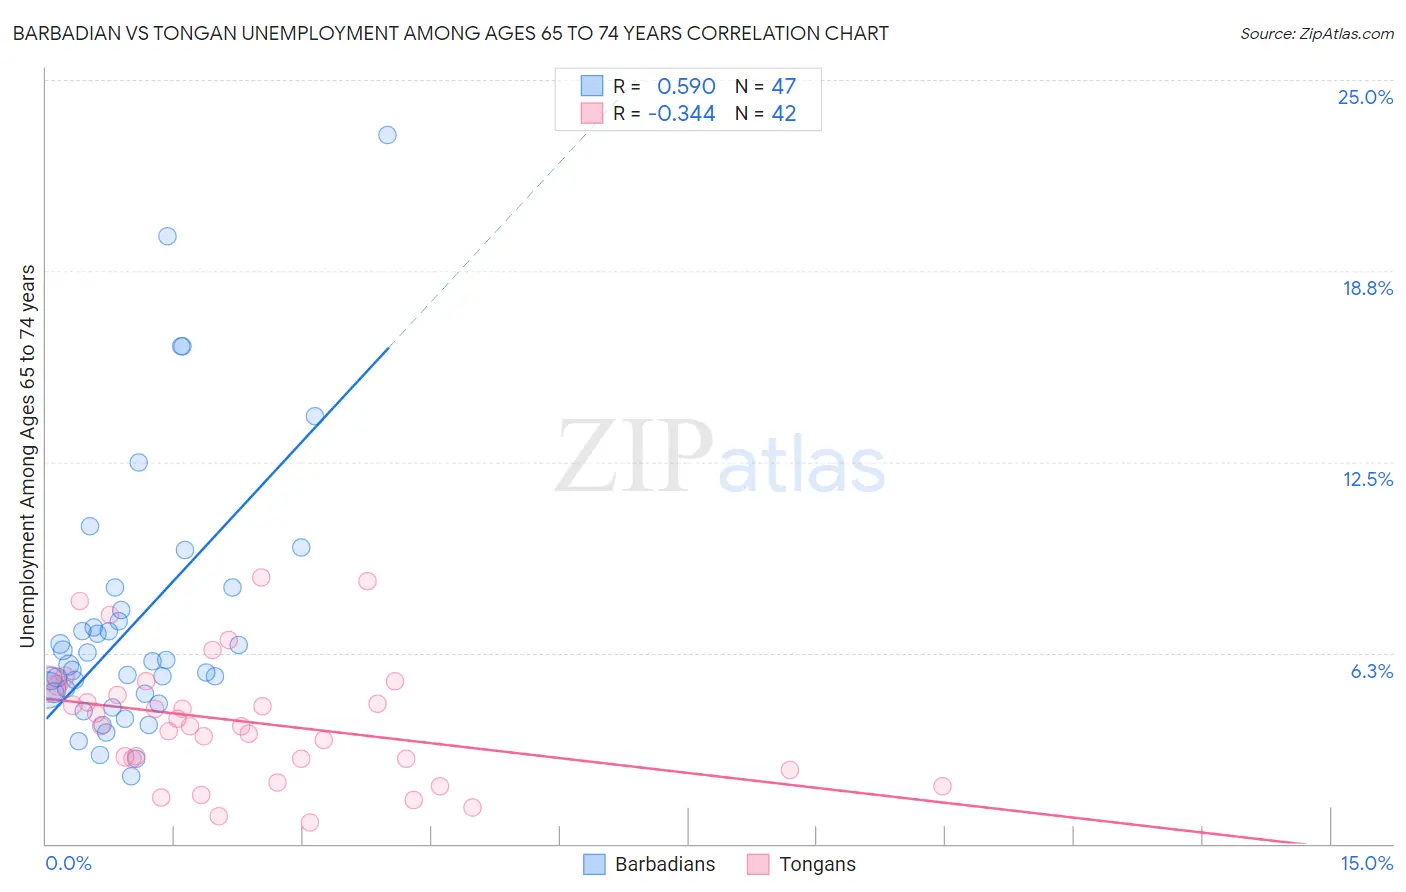
Barbadian vs Tongan Unemployment Among Ages 65 to 74 years Correlation Chart
The statistical analysis conducted on geographies consisting of 135,208,803 people shows a substantial positive correlation between the proportion of Barbadians and unemployment rate among population between the ages 65 and 74 in the United States with a correlation coefficient (R) of 0.590 and weighted average of 5.8%. Similarly, the statistical analysis conducted on geographies consisting of 96,791,109 people shows a mild negative correlation between the proportion of Tongans and unemployment rate among population between the ages 65 and 74 in the United States with a correlation coefficient (R) of -0.344 and weighted average of 4.7%, a difference of 22.6%.
Unemployment Among Ages 65 to 74 years Correlation Summary
| Measurement | Barbadian | Tongan |
| Minimum | 2.2% | 0.70% |
| Maximum | 23.2% | 8.7% |
| Range | 21.0% | 8.0% |
| Mean | 7.2% | 4.0% |
| Median | 5.8% | 3.9% |
| Interquartile 25% (IQ1) | 4.9% | 2.8% |
| Interquartile 75% (IQ3) | 7.7% | 5.2% |
| Interquartile Range (IQR) | 2.8% | 2.4% |
| Standard Deviation (Sample) | 4.4% | 2.0% |
| Standard Deviation (Population) | 4.3% | 2.0% |
Similar Demographics by Unemployment Among Ages 65 to 74 years
Demographics Similar to Barbadians by Unemployment Among Ages 65 to 74 years
In terms of unemployment among ages 65 to 74 years, the demographic groups most similar to Barbadians are Immigrants from Latin America (5.8%, a difference of 0.010%), Ecuadorian (5.8%, a difference of 0.010%), Armenian (5.8%, a difference of 0.12%), Houma (5.8%, a difference of 0.20%), and Liberian (5.8%, a difference of 0.24%).
| Demographics | Rating | Rank | Unemployment Among Ages 65 to 74 years |
| U.S. Virgin Islanders | 0.0 /100 | #292 | Tragic 5.8% |
| Immigrants | Grenada | 0.0 /100 | #293 | Tragic 5.8% |
| Immigrants | Morocco | 0.0 /100 | #294 | Tragic 5.8% |
| Blacks/African Americans | 0.0 /100 | #295 | Tragic 5.8% |
| Pennsylvania Germans | 0.0 /100 | #296 | Tragic 5.8% |
| Houma | 0.0 /100 | #297 | Tragic 5.8% |
| Immigrants | Latin America | 0.0 /100 | #298 | Tragic 5.8% |
| Barbadians | 0.0 /100 | #299 | Tragic 5.8% |
| Ecuadorians | 0.0 /100 | #300 | Tragic 5.8% |
| Armenians | 0.0 /100 | #301 | Tragic 5.8% |
| Liberians | 0.0 /100 | #302 | Tragic 5.8% |
| Arapaho | 0.0 /100 | #303 | Tragic 5.8% |
| Salvadorans | 0.0 /100 | #304 | Tragic 5.8% |
| Mexicans | 0.0 /100 | #305 | Tragic 5.8% |
| Cheyenne | 0.0 /100 | #306 | Tragic 5.8% |
Demographics Similar to Tongans by Unemployment Among Ages 65 to 74 years
In terms of unemployment among ages 65 to 74 years, the demographic groups most similar to Tongans are Immigrants from Congo (4.7%, a difference of 0.16%), Lumbee (4.8%, a difference of 0.18%), Cuban (4.8%, a difference of 0.47%), Osage (4.7%, a difference of 0.57%), and Chickasaw (4.7%, a difference of 0.68%).
| Demographics | Rating | Rank | Unemployment Among Ages 65 to 74 years |
| Sudanese | 100.0 /100 | #5 | Exceptional 4.6% |
| Immigrants | Cuba | 100.0 /100 | #6 | Exceptional 4.6% |
| Indonesians | 100.0 /100 | #7 | Exceptional 4.7% |
| Comanche | 100.0 /100 | #8 | Exceptional 4.7% |
| Chickasaw | 100.0 /100 | #9 | Exceptional 4.7% |
| Osage | 100.0 /100 | #10 | Exceptional 4.7% |
| Immigrants | Congo | 100.0 /100 | #11 | Exceptional 4.7% |
| Tongans | 100.0 /100 | #12 | Exceptional 4.7% |
| Lumbee | 100.0 /100 | #13 | Exceptional 4.8% |
| Cubans | 100.0 /100 | #14 | Exceptional 4.8% |
| Immigrants | North Macedonia | 100.0 /100 | #15 | Exceptional 4.8% |
| Immigrants | Burma/Myanmar | 100.0 /100 | #16 | Exceptional 4.8% |
| Kenyans | 100.0 /100 | #17 | Exceptional 4.8% |
| Creek | 100.0 /100 | #18 | Exceptional 4.8% |
| Menominee | 100.0 /100 | #19 | Exceptional 4.8% |